Dashboard Creation Guide
Eratos Grafana Dashboard Creation
For official Grafana documentation: CLICK HERE
This guide will outline 2 ways to build a Grafana Dashboard:
- Build from scratch
- Build by editing a previously generated dashboard, useful for generating dashboards for new platforms
1. Build a Dashboard from Scratch
1.1 Make sure you are in the correct Organisation
Change Grafana Org Guide
1.2 Create new Dashboard within Org
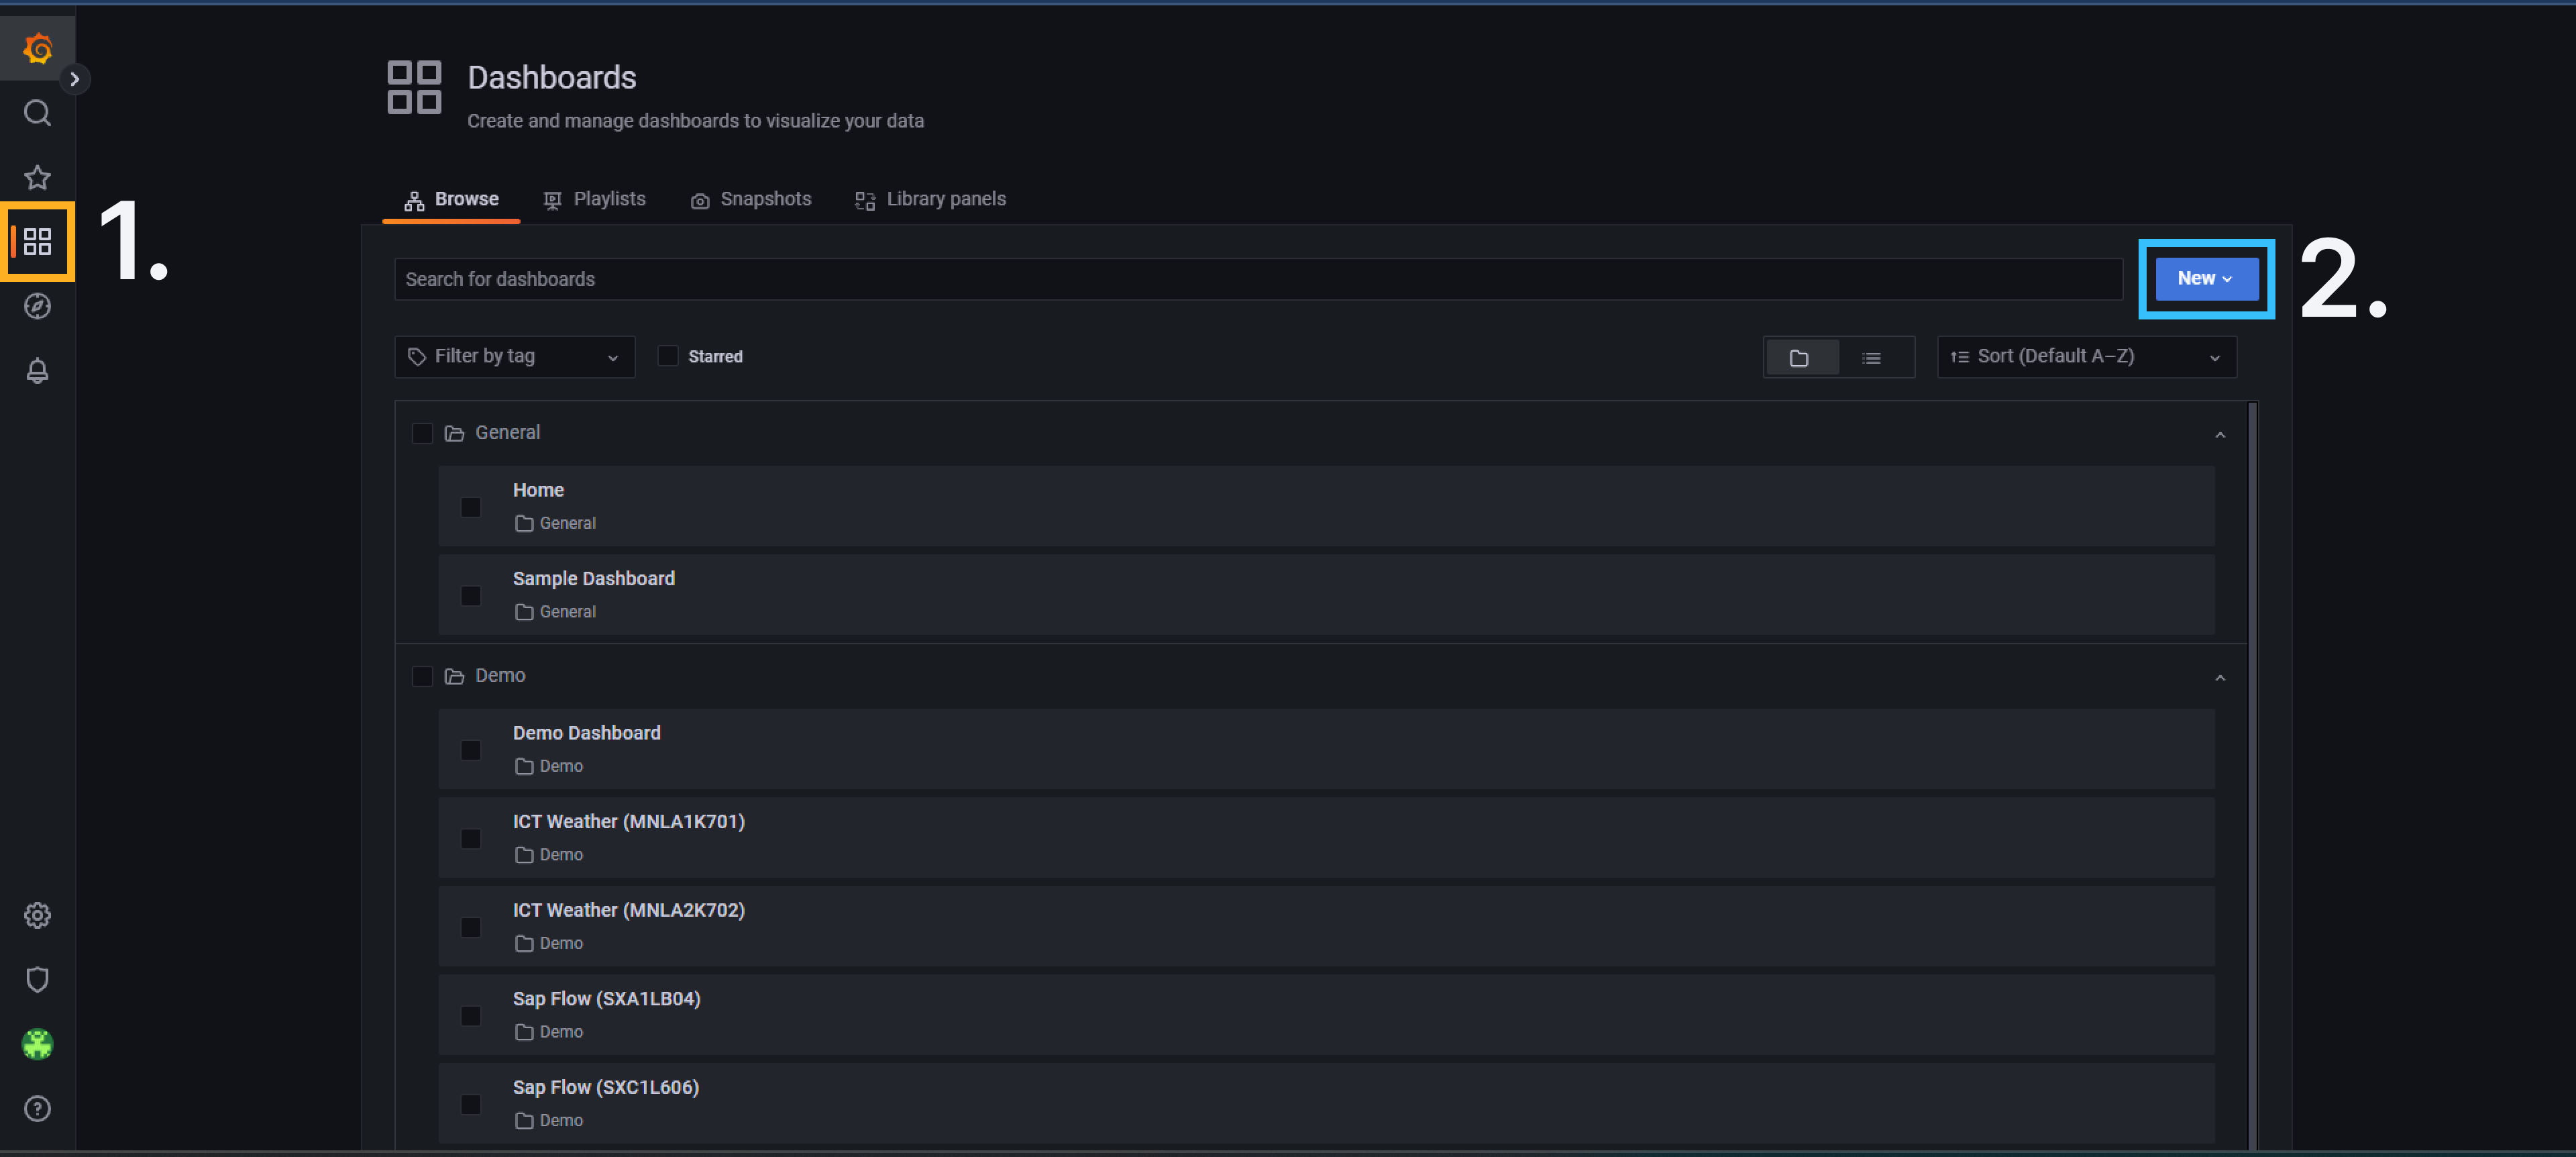
- Click on the Dashboard Icon in the top left-hand corner
- Click New -> New Dashboard
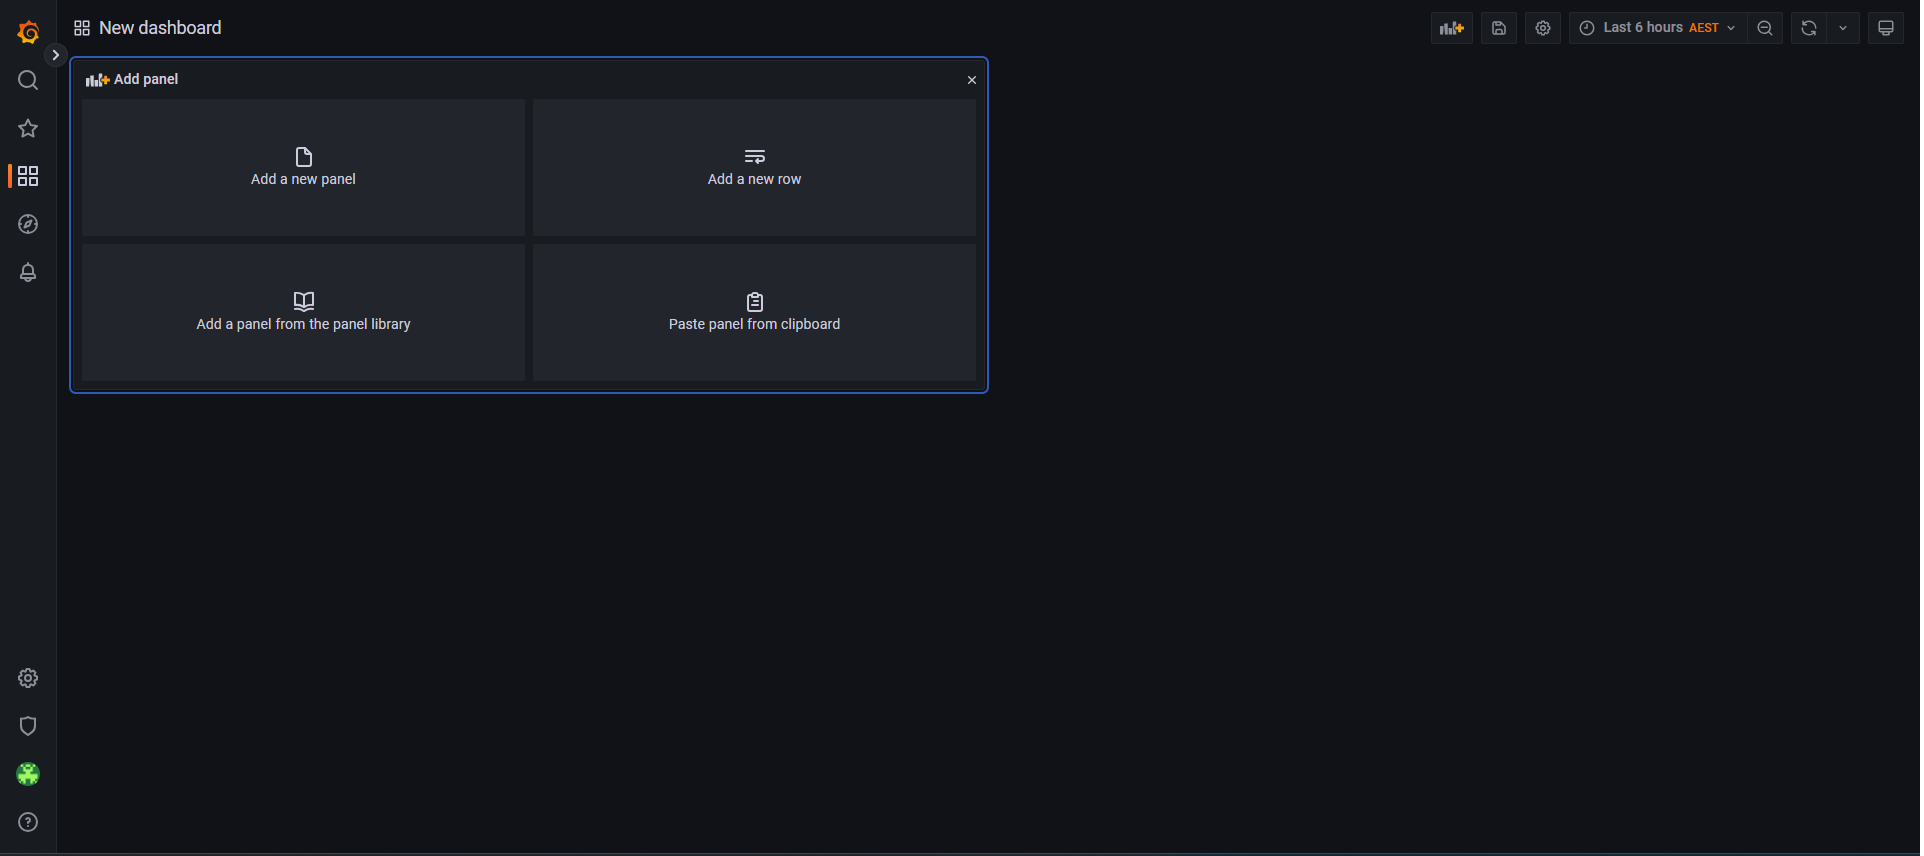
New Panel
- Click "Add a new Panel"
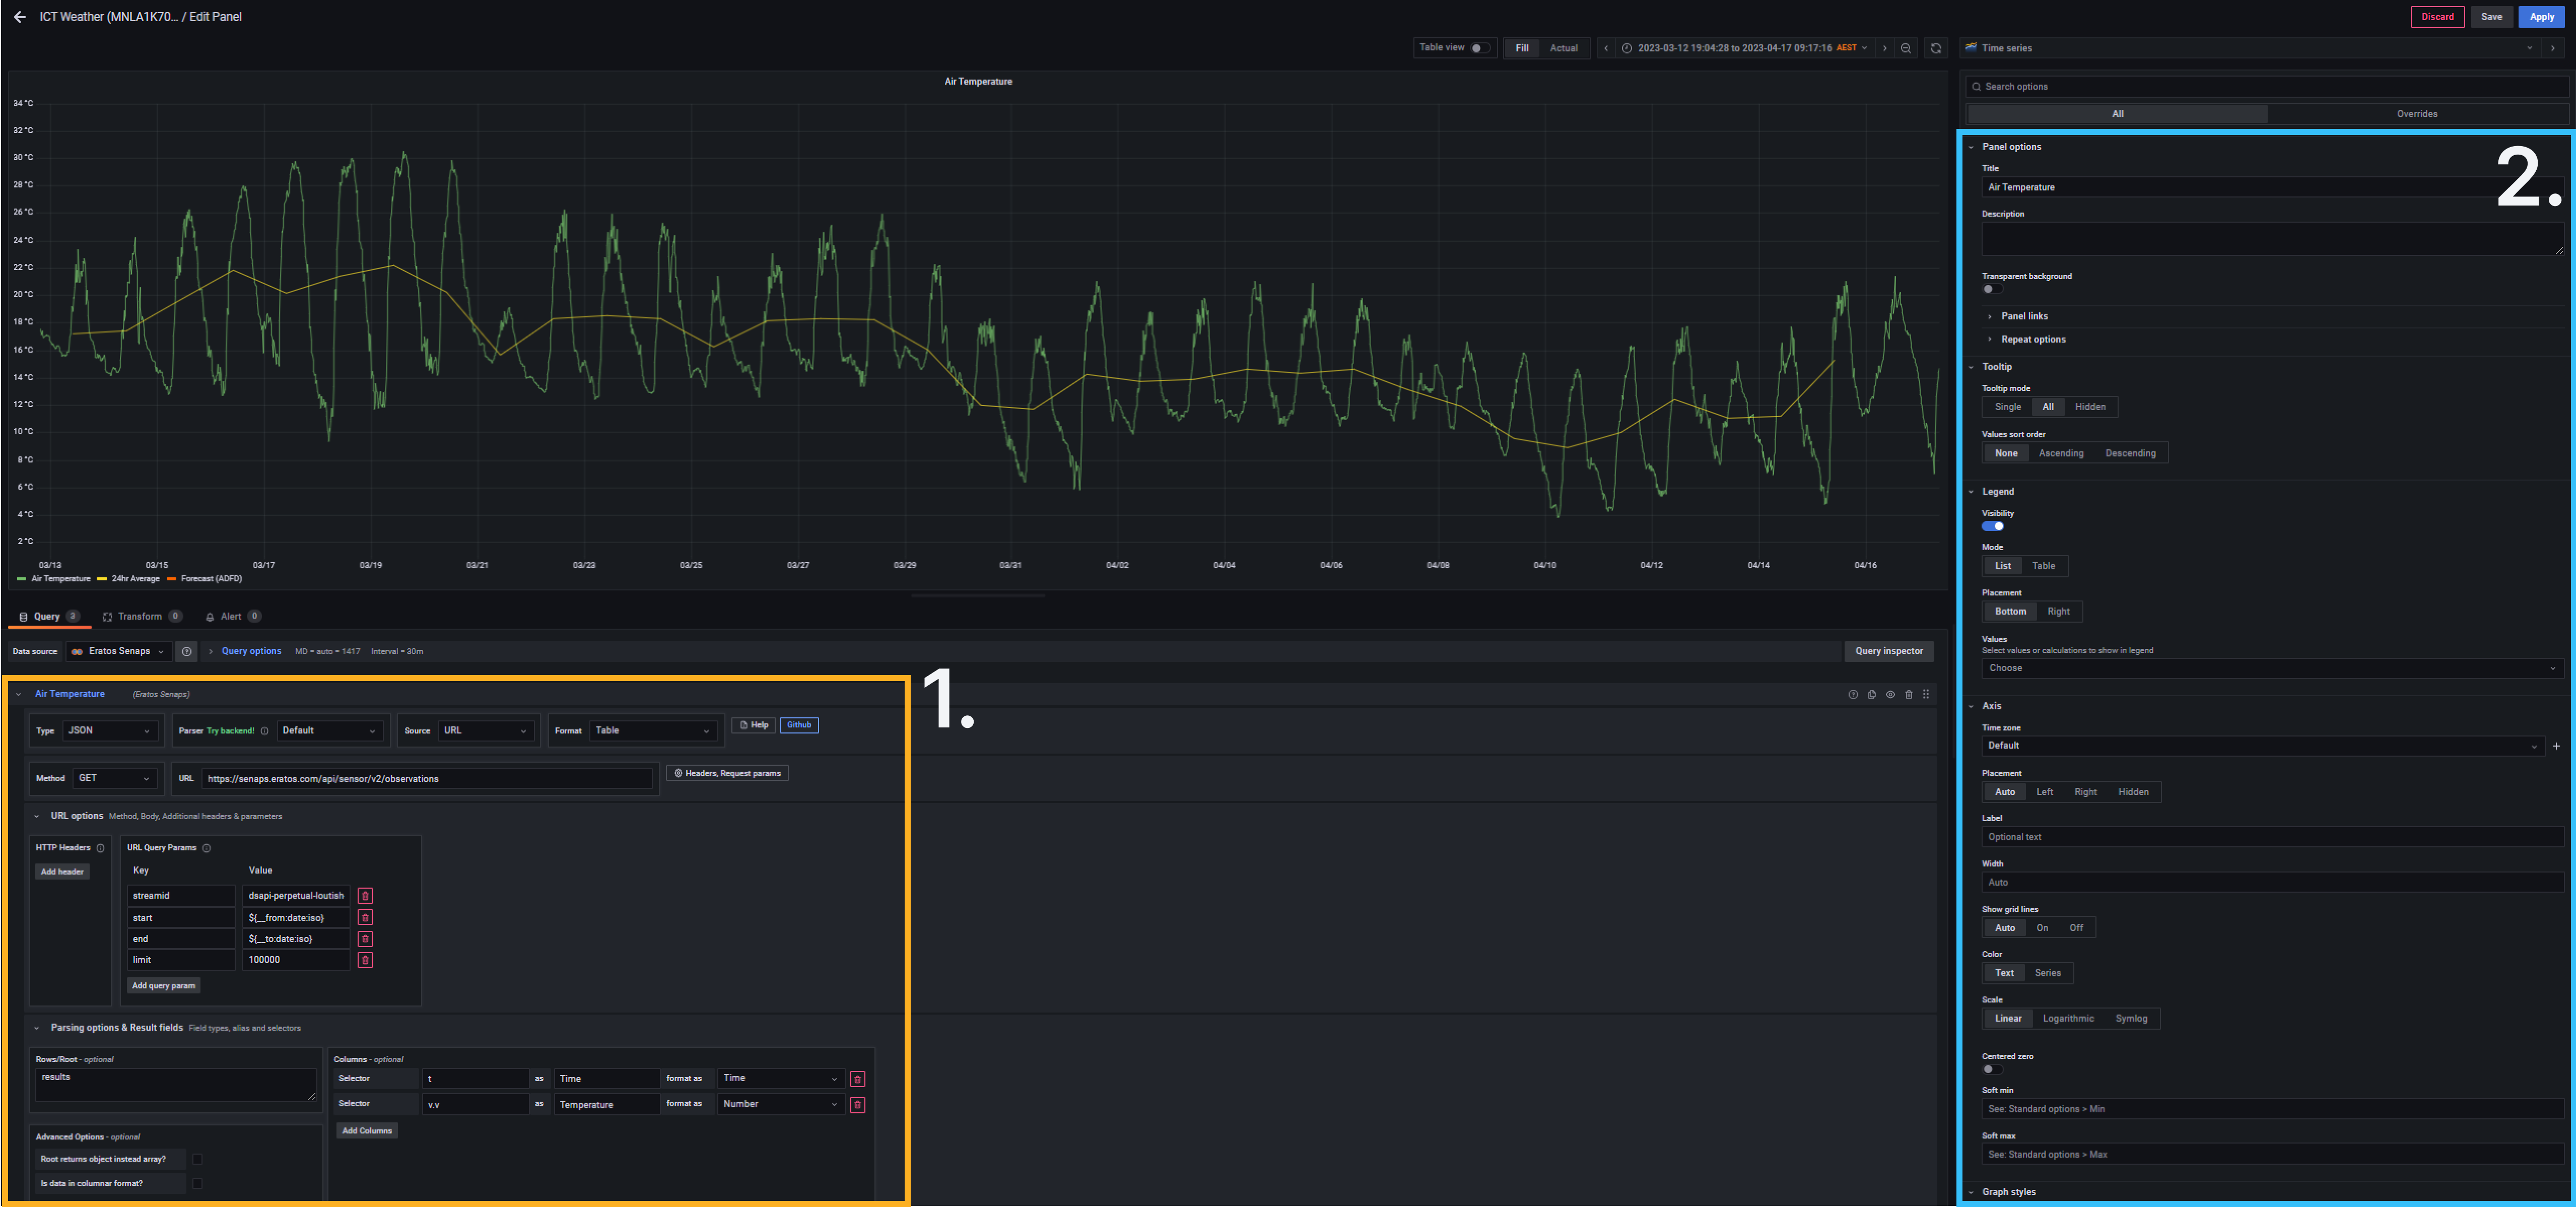
1.2 Timeseries Panel overview
- Area 1: Is where all the data input parsing coming from Senaps is done
- Once Area 1 has been correctly configured, you can use area 2 to edit the design and aesthetic of the plot
1.2.1 Timeseries Data Input
To turn your raw panel into a Timeseries plot pulling from Senaps please follow the below instructions.

- Change the URL to: https://senaps.eratos.com/api/sensor/v2/observations
- Click Headers, Request params
- Under
URL Query Param - Click "Add Query Param" 4 times
- Under
- Set the following Parameters as per below:
| Key | Value | Value Example |
|---|---|---|
| streamid | platformid.streamid | dsapi-perpetual-loutish-grocery-ict_international.mnla1k701.sdi_1.air-temperature |
| start | ${__from:date:iso} | ${__from:date:iso} |
| end | ${__to:date:iso} | ${__to:date:iso} |
| limit | The Limit on number of observations returned | 100000 |
- In the
Row/Rootsfield enterresults - Click the > to the left of Parsing options & Result fields
- Click Add Columns twice
- Set the two-column variables as below:
| Selector | as | format as |
|---|---|---|
| t | Time | Time |
| v.v | Temperature (Variable Name) | Number |
If you wish to add multiple timeseries on the same plot, simply duplicate the original query created and edit it, or click add query to construct another data query that will add the timeseries to the plot.
1.3 Gauge Panel overview
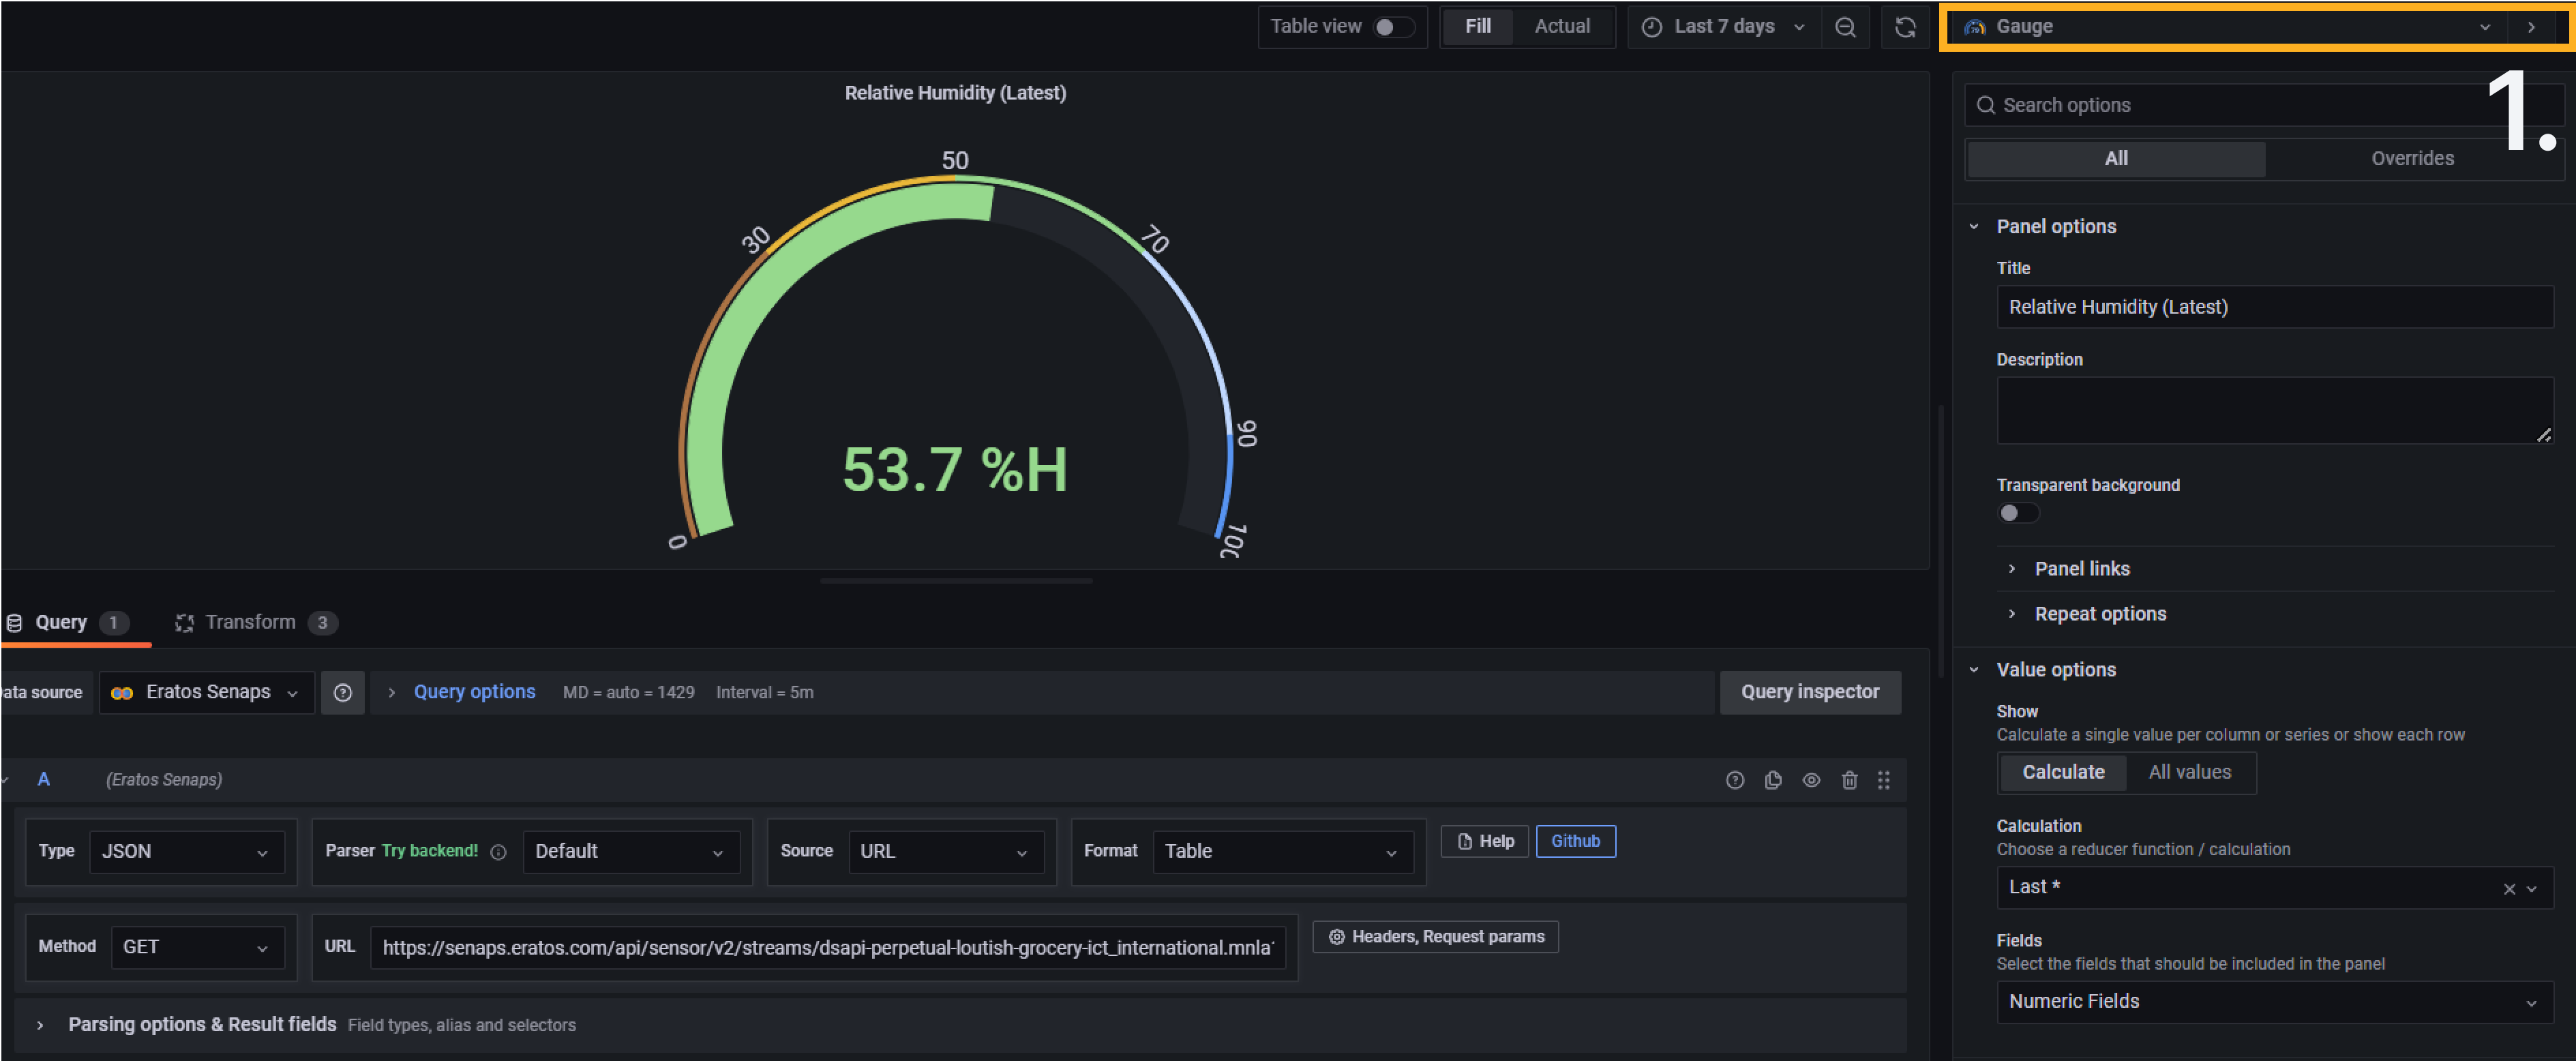
- The default panel selected is a timeseries panel
- In the Top right hand-corner you can change the chart type: Select Gauge
1.3.1 Gauge Panel Data Input
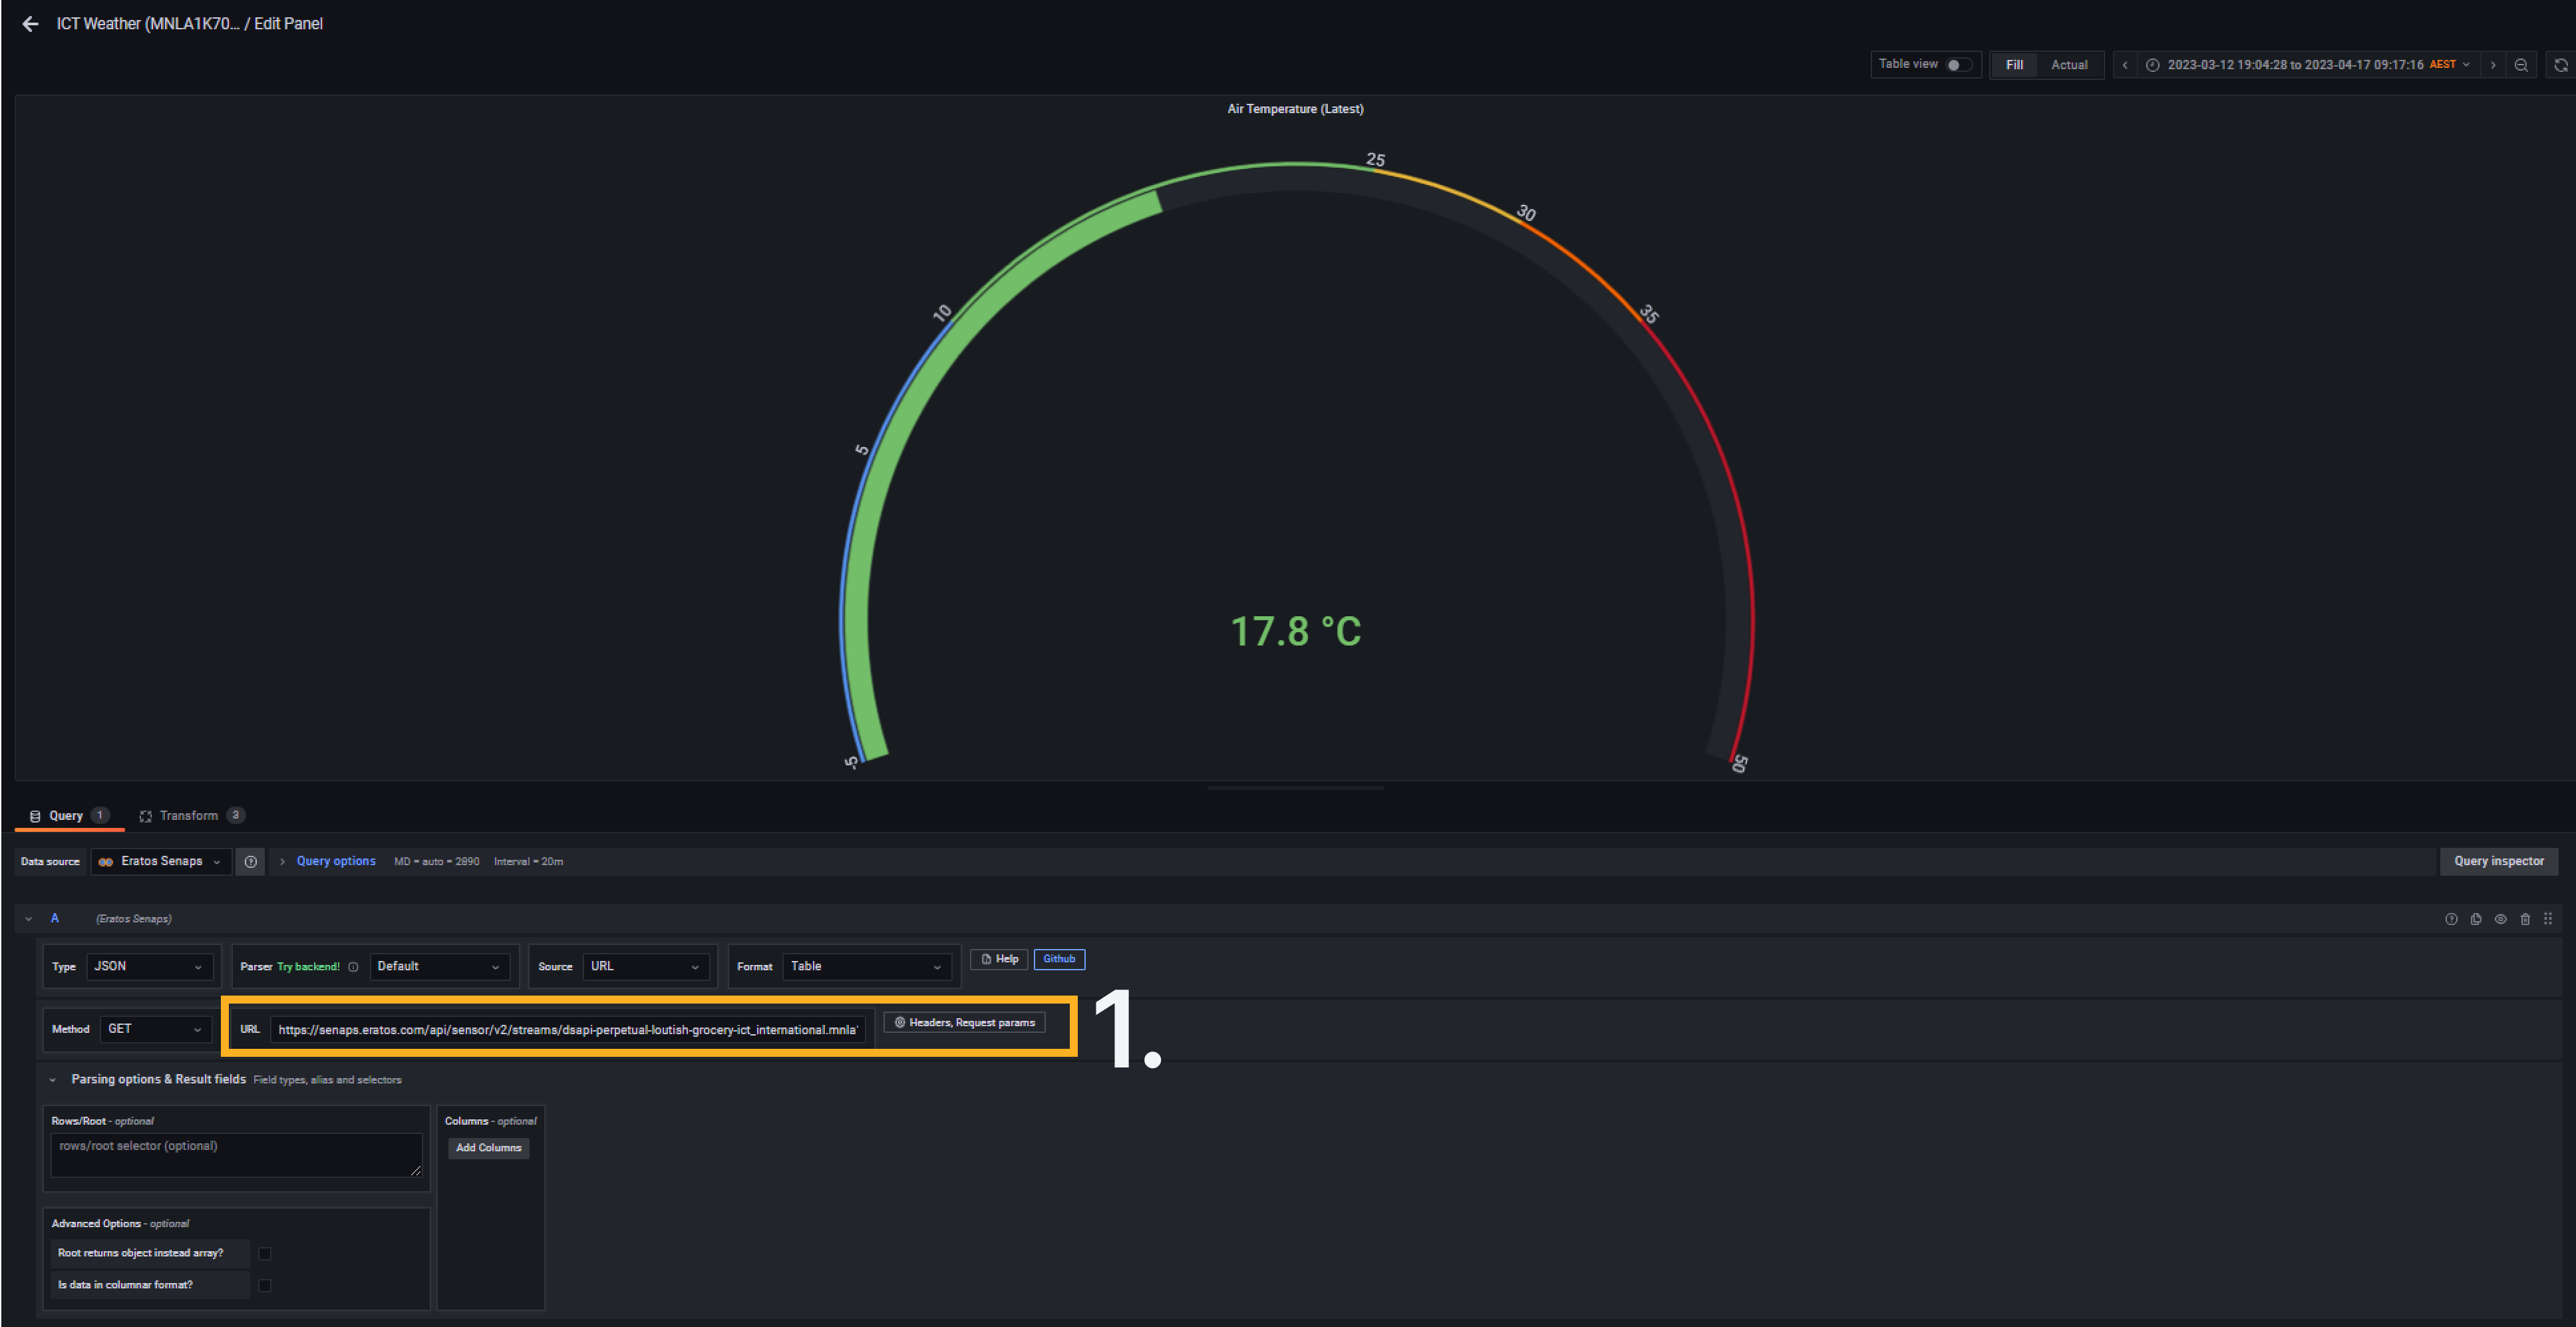
- For Dial panels only, the URL needs to be updated on the data input side.
The URL is broken up into two halves:
https://senaps.eratos.com/api/sensor/v2/streams/ streamid
1.3.2 Gauge Panel Data Transform
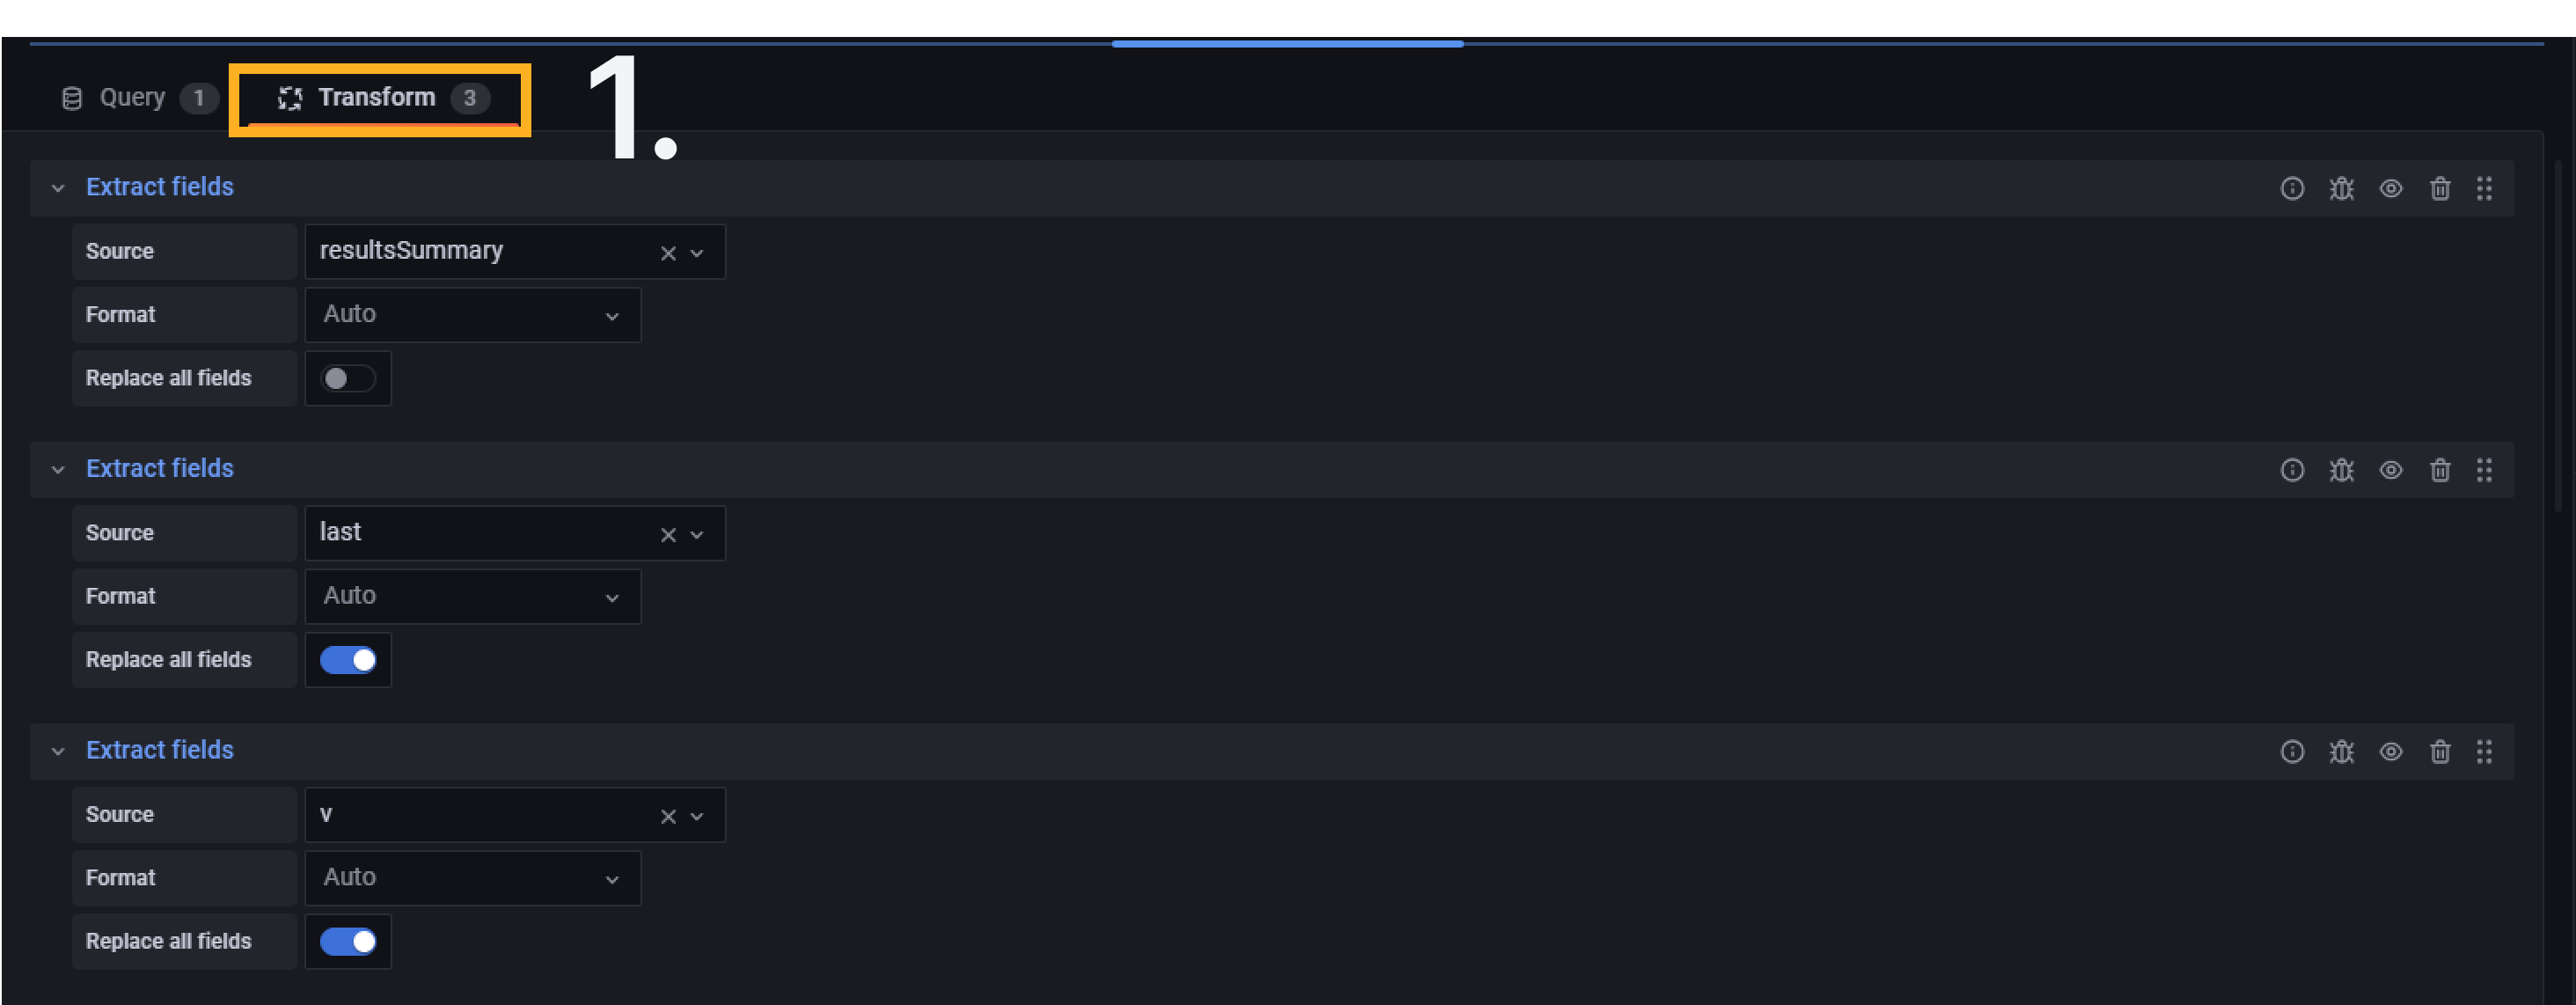
- Click the Transform button to access the Transform Area
- In the search bar "Add Transformation", Search "Extract Fields"
- Click Extract Fields
- Edit the Source to be "resultsSummary"
- Click "Add Transformation" and repeat steps 2-3
- In the new Extract Fields, Edit the Source to be "last"
- Click "Add Transformation" and repeat steps 2-3
- In the new Extract Fields, Edit the Source to be "v"
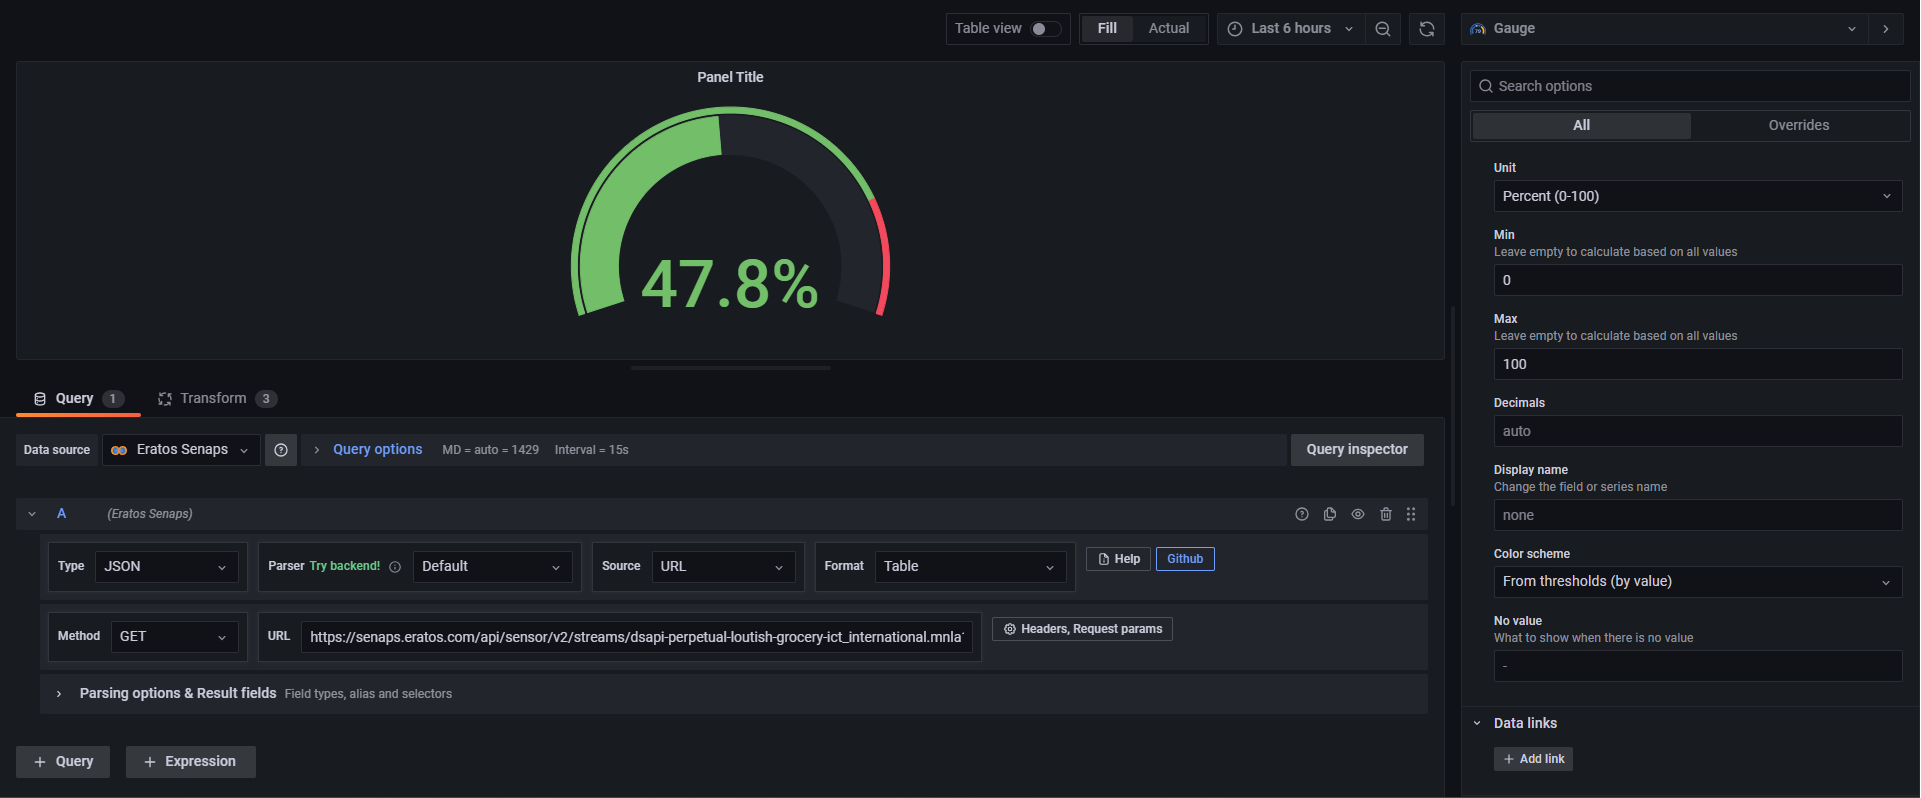
Now in the right hand side you can change the Units, Min, and Max values that makes sense based on the variable being displayed. If you use the above example stream id, you should end with a dial like this.
1.4 Save Dashboard | Create new Panel
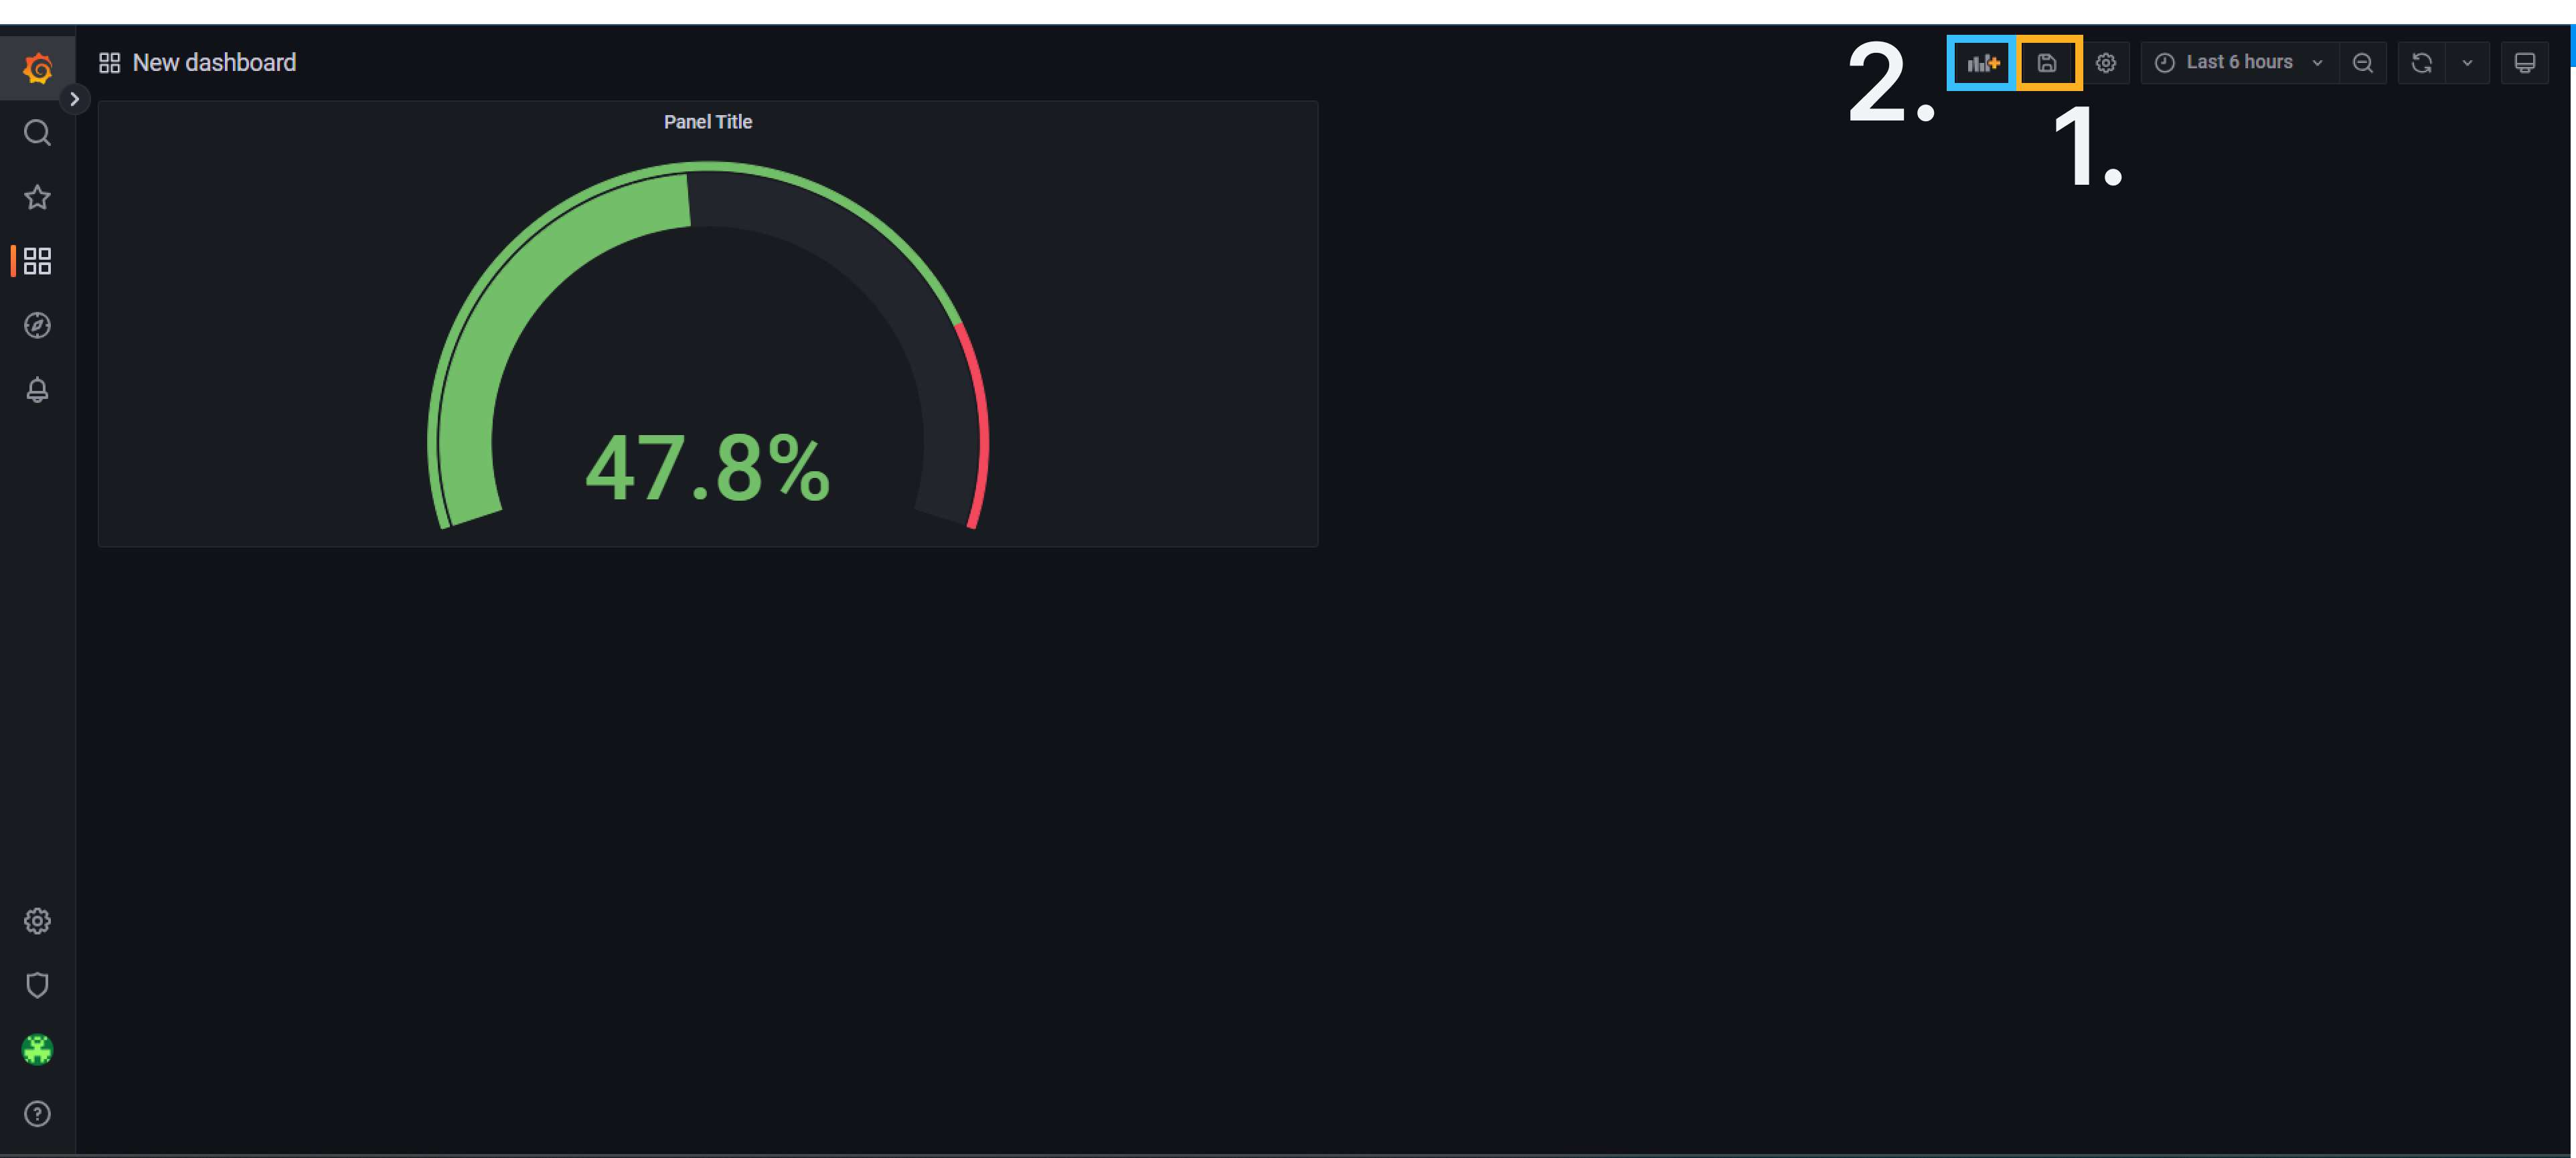
- Click the save icon to save the dashboard and your hard work
- Click the Add Panel Icon to create a new Panel
2. Create a Dashboard from an Existing Dashboard
2.1 Export existing dashboard
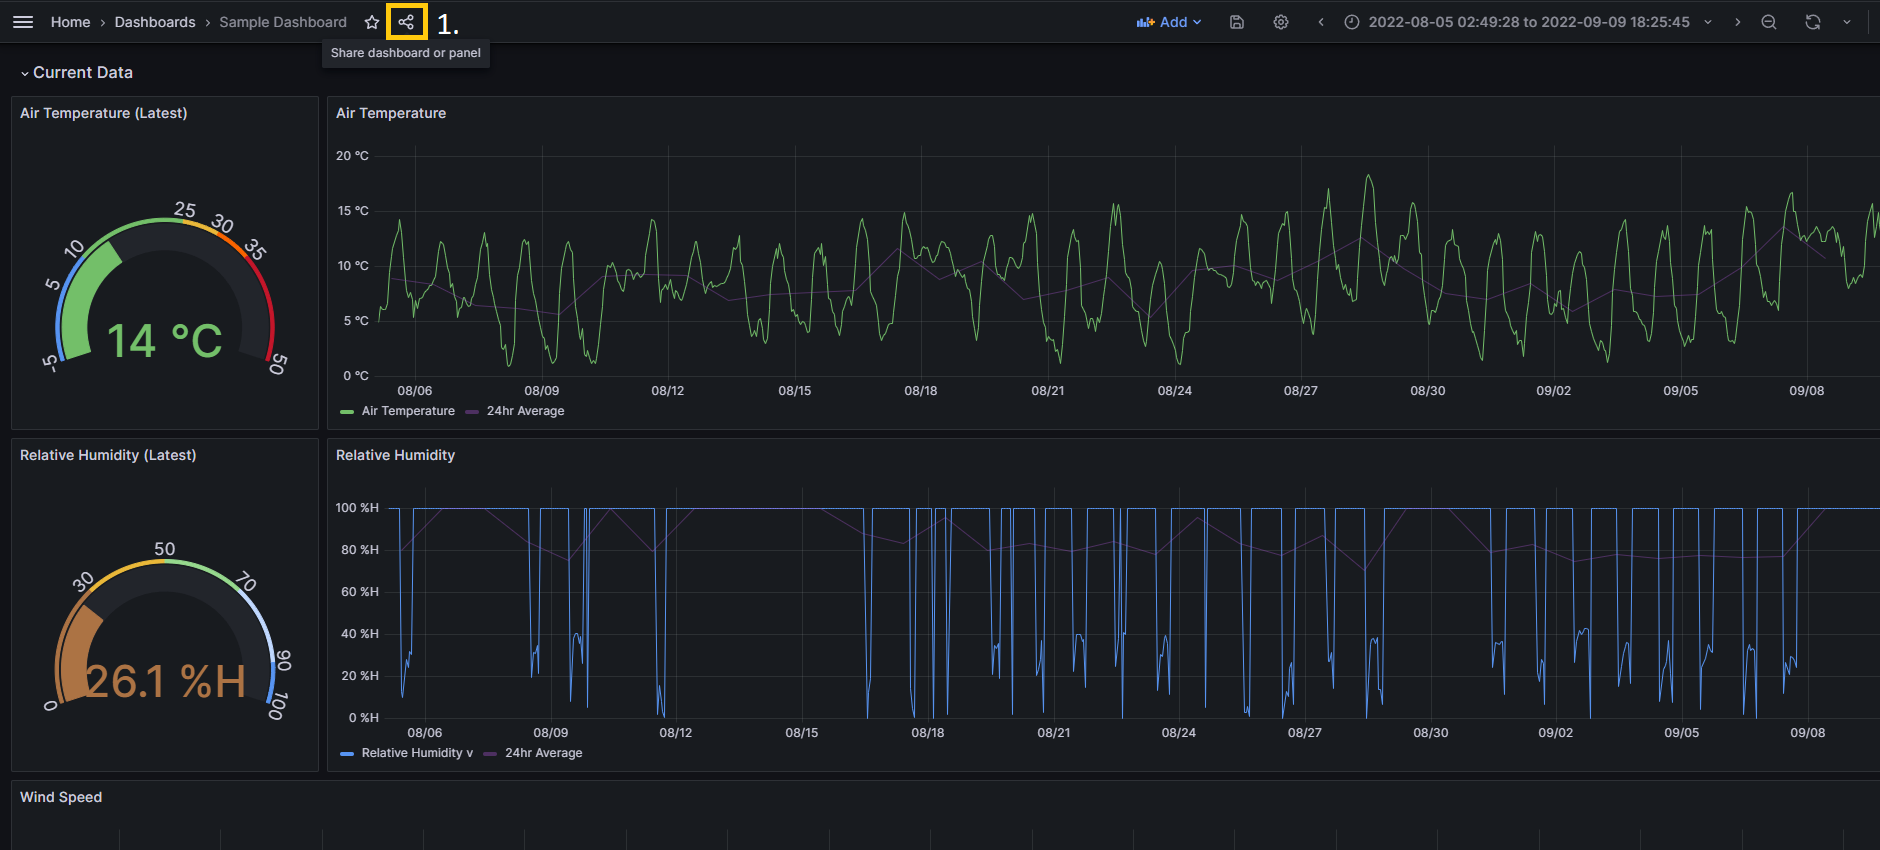
Navigate to the dashboard you would like to emulate and click the "Share" Icon next to the name of the dashboard.
Click the Export tab, slide the slider to choose "Export for sharing internally, and click save to file.
2.2 Update JSON information
Next, run this script on the exported JSON to update it with the new datastreams. This script is basically a configured find and replace.
You will need the following information:
- Senaps API Key
- List of platform IDs you would like to create dashboards for.
- The platform ID of the dashboard you just explorted.
import json
import pprint
import re

def replace_input_with_replacement(input_string,pattern,replacement):
    #input string = full document
    # pattern = what code is looking for

    updated_string = re.sub(pattern, replacement, input_string)
    return updated_string

#ENTER CONFIG INFORMATION
senaps_key = '<ENTER YOUR SENAPS KEY>'
user_readable_dashboard_type  = '<ENTER YOUR PLATFORM TYPE>' #This can be freely chosen and forms part of the dashboard title
old_platform_id =  '<ENTER OLD PLATFORM ID>'
dashboard_JSON_file_location = r'<ENTER JSON FILE LOCATION>'
platform_id_list = [
                    	"<ENTER PLATFORM IDs AS A LIST>"
                    ]

#Program
for new_platform_id in platform_id_list:

    with open(dashboard_JSON_file_location) as file:

        json_string = file.read()

    json_string = replace_input_with_replacement(json_string,old_platform_id,new_platform_id)

    title = f"{user_readable_dashboard_type} ({new_platform_id[-8:].upper()})"

    json_dict = json.loads(json_string)

    json_dict['title'] = title
    json_dict['uid'] = new_platform_id[-8:].upper()


    #Write dictionary to JSON file
    with open(f'\outputs\{title}.json', 'w') as file:
        json.dump(json_dict, file)

    print(title,"Done")

exit()
2.3 Manage errors, conflicts and title changes
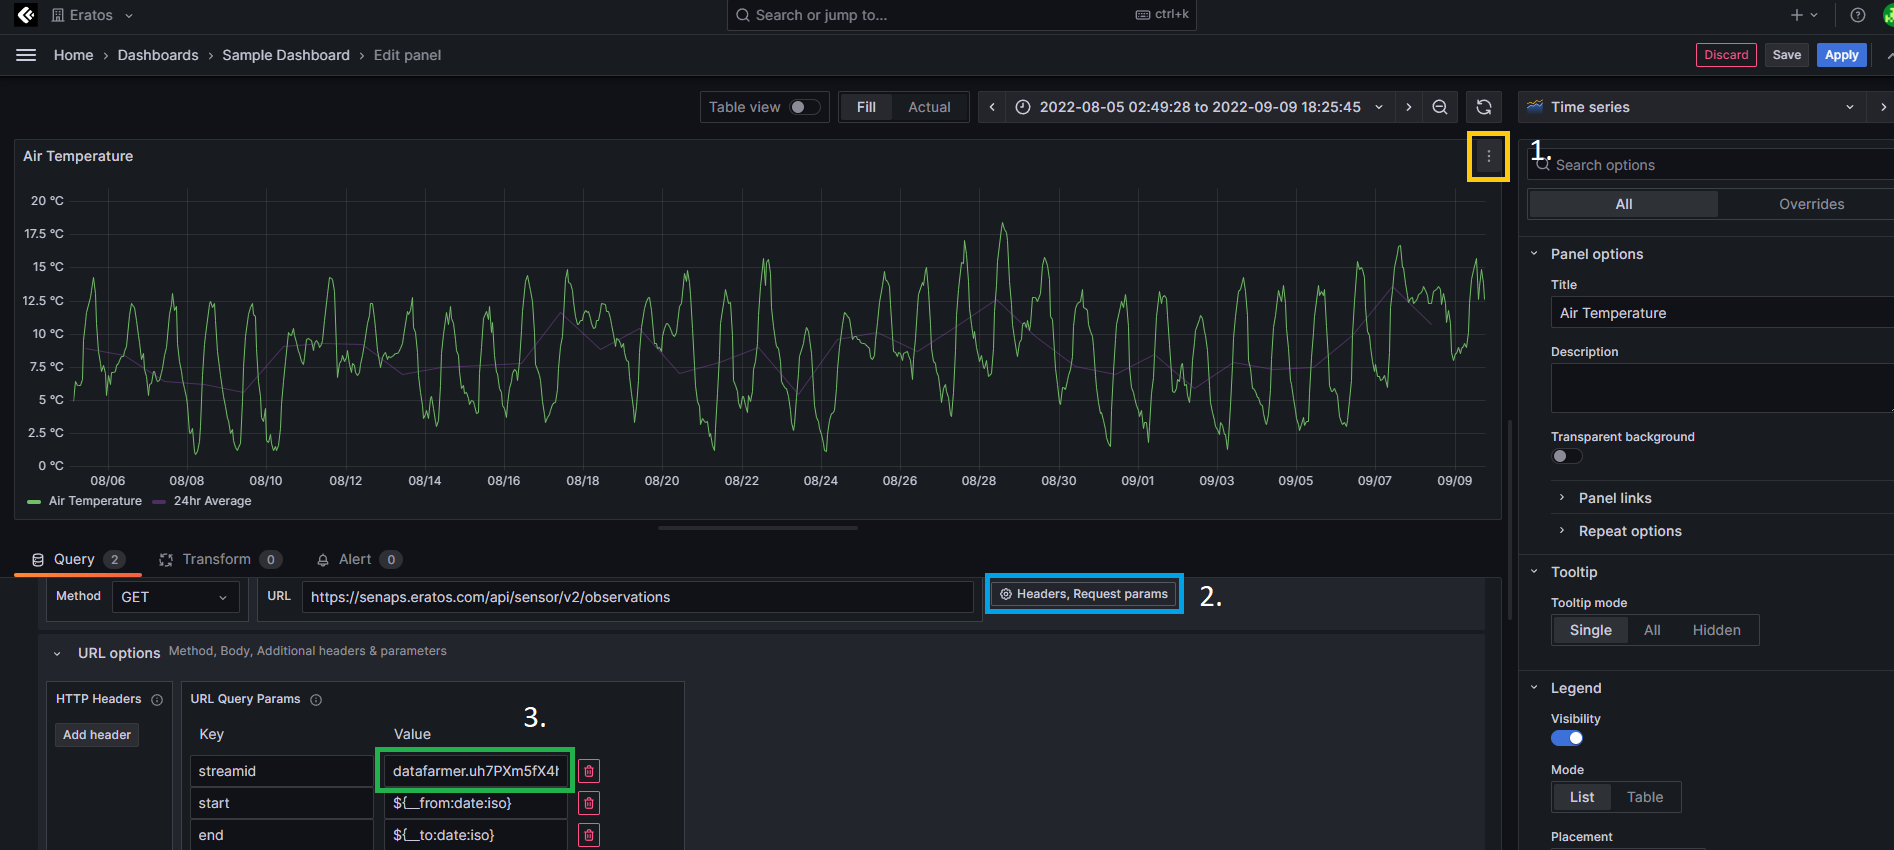
Unless the new platforms have been configured identically to the donor dashboard, it is likely that the streamids will still be a little different, ie .air_temp vs .air_temperature. To get the right data onto your dashboard, find the panel you would like to reconfigure, click the 3 dots to the top-right of the panel and click edit.
Then, under the query name, click the "Headers, Request params" button to show the URL Query Params option.
Finally, edit the streamid value to be the desired stream ID found in Senaps.
At this stage, you can also rename the Query name, Panel title and other panel configuration settings. More information about these options can be found on Grafana's official Docs
Updated 6 months ago
