Get Geospatial Grid at a Time as Array
What is a Geospatial Grid
Geospatial Grids are how areas or locations on planet Earth are represented in a generalized manner through data. The discrete dissection of grids is dependent on their resolution, and when mapping the whole planet, high-resolution grid files can be extremely large. The size of these grids is inhibitive for everyday users, Eratos alleviates this through a selection of functions that return a defined subset of the large underlying data.
Gridded Data Structure and Extraction
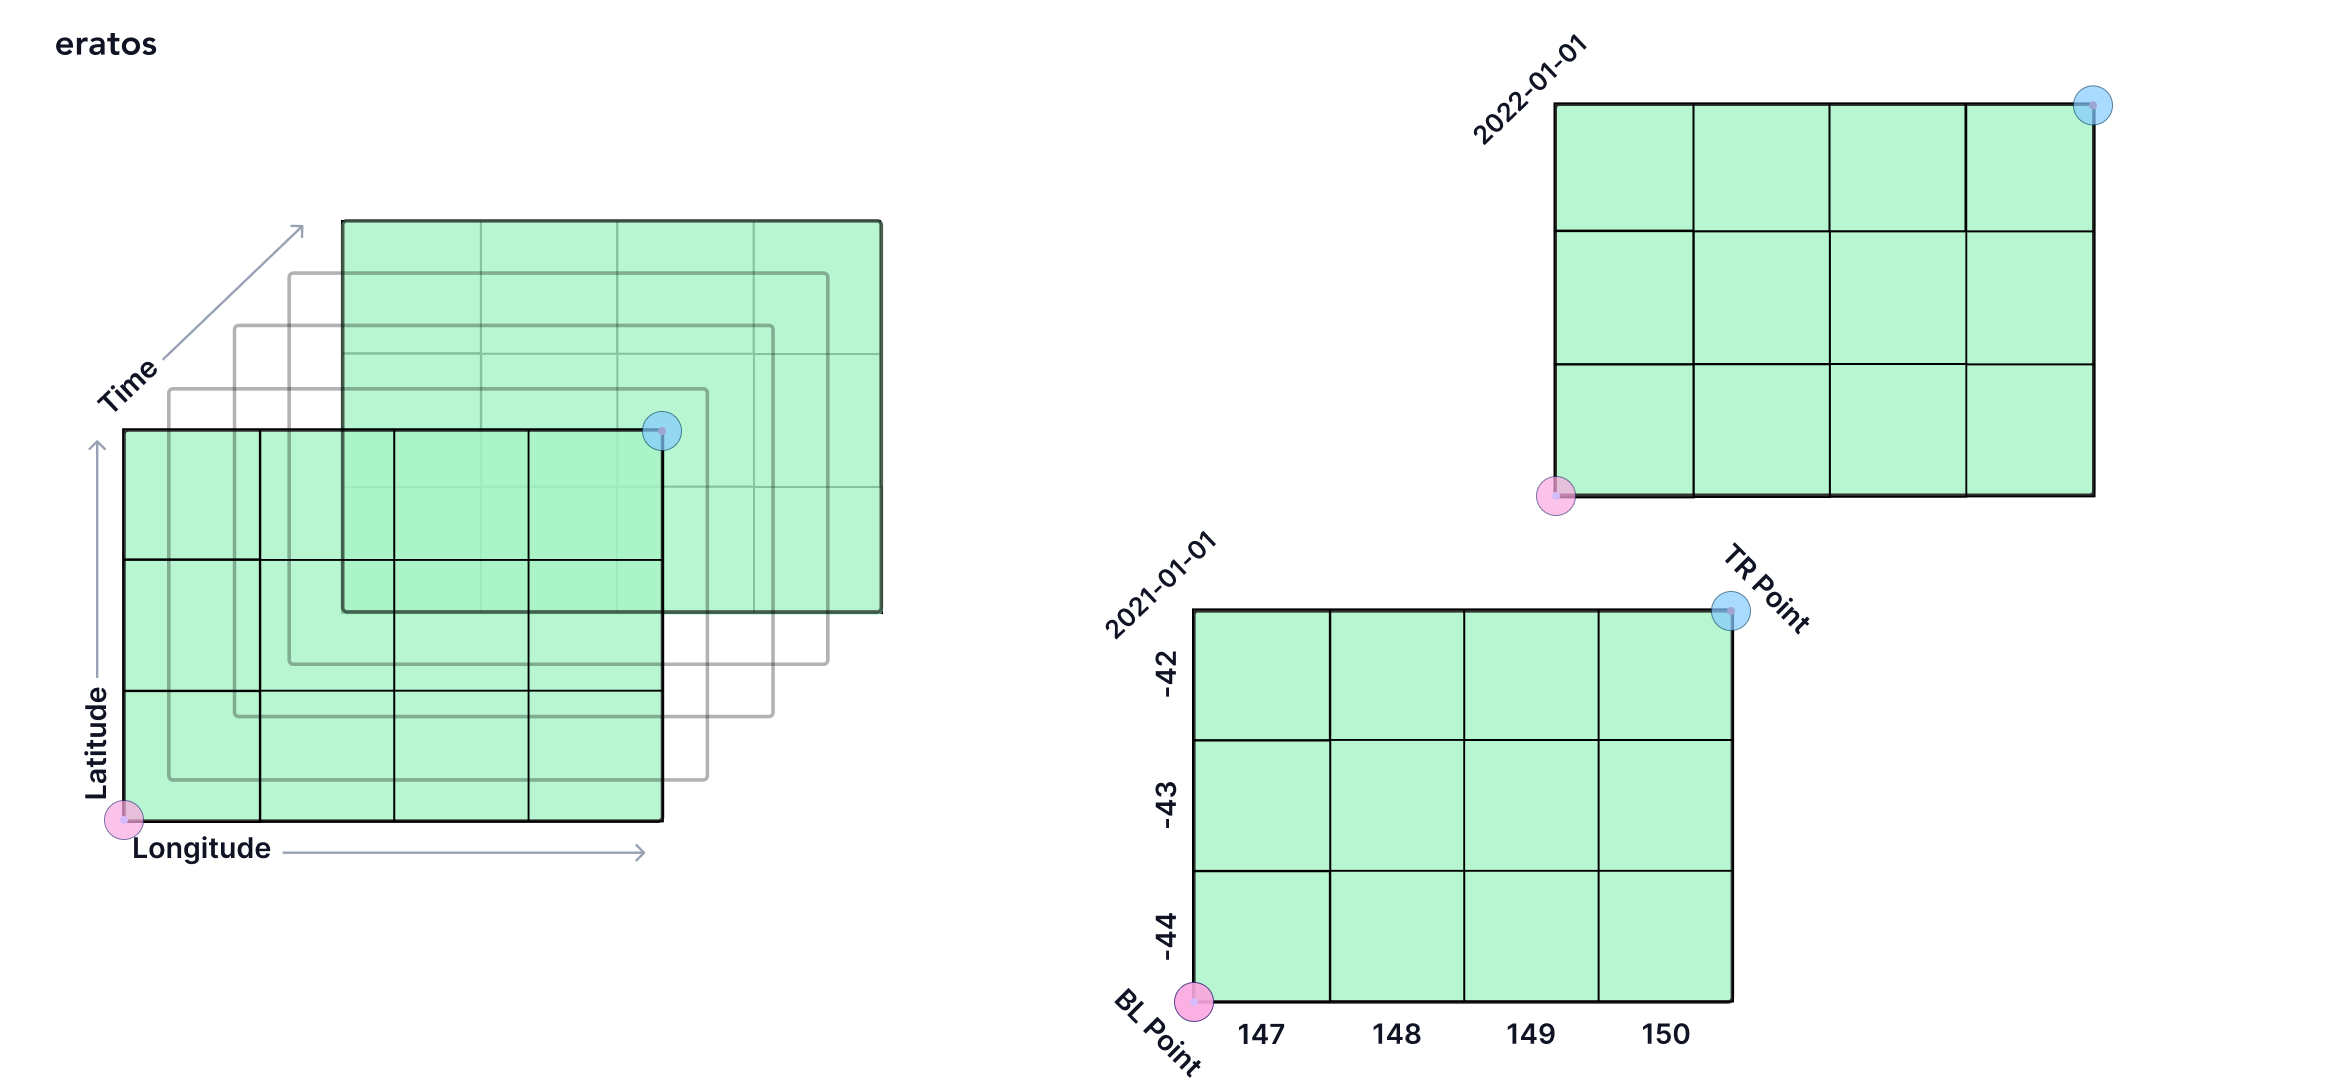
Most Gridded data is three-dimensional, the Eratos standard is to define these dimensions in Time, Latitude, and Longitude. The below figure is a visualization of those 3 dimensions, longitude on the x-axis, latitude on the y-axis, representing location, and time on the z-axis.
As seen below, every cube is defined by discrete intervals in all 3 dimensions, in this example x and y increment in 1-degree intervals, whereas the time increment is dependent on the temporal frequency of the underlying dataset, the specific intervals for a given dataset can be found through the: [Print Gridded Dataset Metadata](<https://docs.eratos.com/docs/print-gridded-dataset-metadata) function.
Here we have extracted two individual grids on the 1st of January 2021 (2021-01-01) and on the 1st of January 2022 (2022-01-01), with the geospatial boundaries defined by Bottom Left Point (BL Point) Point (147, -44) and Top Right Point (TR Point) Point (150, -42).

Get Geospatial Grid at Times as Array Function
You can extract a desired geospatial grid at a given point of an Eratos gridded dataset using the get_geospatial_slice_at_times_as_array function which has the following definition:
res = edata_gridded.get_geospatial_slice_at_times_as_array(
var,
time_list,
bottomLeftPoint,
topRightPoint,
lat_stride = 1,
lon_stride = 1,
verbose = True
)
where,
edata_gridded: A gridded Eratos dataset that contains the key variablevar: The variable key of the variable to fetchtime_list: An array of [Eratos Date-Times Data Standards](<https://docs.eratos.com/docs/datetime-standards) with a minimum of 1bottomLeftPoint: The bottom left point for the fetched Geospatial Grid: "POINT(147, -44)" following the Eratos [Location Data Standards](<https://docs.eratos.com/docs/date-standards)topRightPoint: The top right point for the fetched Geospatial Grid: "POINT(150, -42)"lat_stride: The stride in the latitude dimension, default = 1lon_stride: The stride in the longitude dimension, default = 1- 'verbose : Get print statement that details the specifics of the output (True/False), default = True
Function Standard Use Case
#Eratos adapter and credentials system
from eratos.creds import AccessTokenCreds
from eratos.adapter import Adapter
from getpass import getpass

eratos_id = getpass('Enter the eratos key id:')
eratos_secret = getpass('Enter the eratos secret:')

ecreds = AccessTokenCreds(
  eratos_id,
  eratos_secret
)

eadapter = Adapter(ecreds)

# Request acccess to a dataset resource in Eratos
max_temperature_data = eadapter.Resource(ern='ern:e-pn.io:resource:eratos.blocks.silo.maxtemperature')

# Access the gridded dataset via the Gridded API:
gridded_max_temperature_data = max_temperature_data.data().gapi()

# Query the Gridded API to see what variables are inside the dataset
print(dict.keys(gridded_max_temperature_data.variables()))

times = ["2021-01-01","2022-01-01"]
#9 times out of 10 this will be the variable you are after in this case ('max_temp')
var = gridded_max_temperature_data.get_key_variables()[0]
bottomLeftPoint = 'POINT(142.180431 -38.189593)'
topRightPoint = 'POINT(149.271033 -34.598160)'

extracted_data = gridded_max_temperature_data.get_geospatial_slice_at_times_as_array(var,
times, bottomLeftPoint, topRightPoint)
reticulate::use_condaenv("eratoslabs", required=TRUE)
library(reticulate)
library(rjson)
eratosAdapter <- reticulate::import("eratos.adapter")
eratosCreds  <- reticulate::import("eratos.creds")


path_to_eratos_creds = "PATH_TO_CREDS_AS_JSON_FILE"
creds = fromJSON(file = path_to_eratos_creds)

at <- eratosCreds$AccessTokenCreds(creds$key[1], creds$secret[1])
ad <- eratosAdapter$Adapter(at)

# Pull a dataset resource in Eratos via it's unique ern
max_temperature_data = ad$Resource(ern='ern:e-pn.io:resource:eratos.blocks.silo.maxtemperature')

# Access the gridded dataset via the Gridded API:
gridded_max_temperature_data = max_temperature_data$data()$gapi()

# Query the Gridded API to see what variables are inside the dataset
gridded_max_temperature_data$variables()

times =c("2021-01-01","2022-01-01")
#9 times out of 10 this will be the variable you are after in this case ('max_temp')
var = gridded_max_temperature_data.get_key_variables()[1]
bottomLeftPoint = 'POINT(142.180431 -38.189593)'
topRightPoint = 'POINT(149.271033 -34.598160)'

extracted_data = gridded_max_temperature_data$get_geospatial_slice_at_times_as_array(var,
times, bottomLeftPoint, topRightPoint)
This function contains a detailed output of what is going on under the hood, so you can best understand if this is your intended output.

The 2 in the first dimension of the shape (2, 139, 140) of the 3D Numpy Array Object represents the 2 points in date-time we requested in chronological order
Recipe to come up with how this function is used in a solution
Updated 6 months ago
