Get 3D Subset as Array (Area over time)
Eratos' distributed network hosts complete datasets, sometimes terabytes in size, so your local environment only has to process the exact subset of that dataset you're interested in. The previous examples show a 1 and 2-dimensional extraction, now we will delve into extracting a 3-dimensional subset as a Numpy Array.
Gridded Data Structure and Extraction
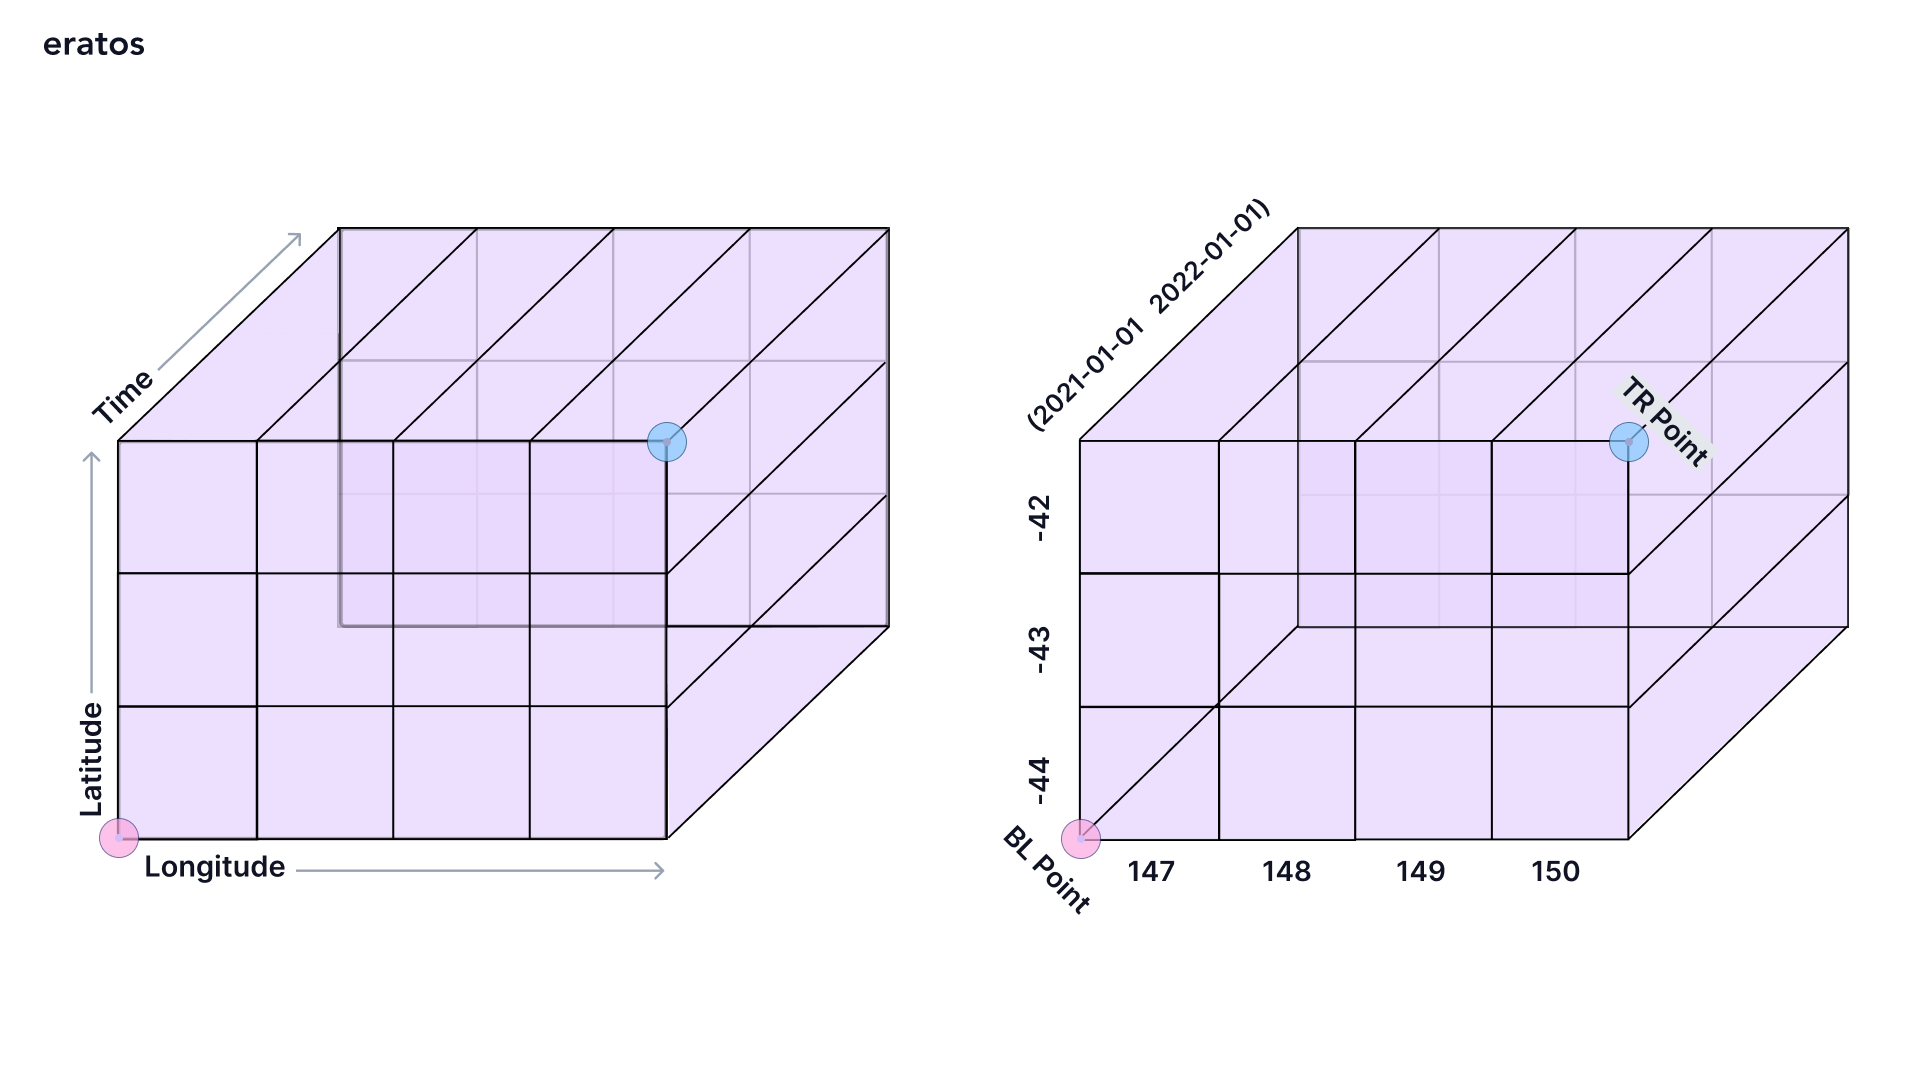
Most Gridded data is three-dimensional, the Eratos standard is to define these dimensions in Time, Latitude, and Longitude. The below figure is a visualization of those 3 dimensions, longitude on the x-axis, latitude on the y-axis, representing location, and time on the z-axis.
As seen below, every cube is defined by discrete intervals in all 3 dimensions, in this example x and y increment in 1-degree intervals, whereas the time increment is dependent on the temporal frequency of the underlying dataset, the specific intervals for a given dataset can be found through the: Print Gridded Dataset Metadata function.
Here we have extracted one 3D subset from the 1st of January 2021 (2021-01-01) to the 1st of January 2022 (2022-01-01), with the geospatial boundaries defined by Bottom Left Point (BL Point) Point (147, -44) and Top Right Point (TR Point) Point (150, -42).

Figure x
Get 3D Subset as Array Function
You can extract a desired 3D subset of an Eratos gridded dataset using the get_3d_subset_as_array function which has the following definition:
res = edata_gridded.get_3d_subset_as_array(
var,
startDate,
endDate,
bottomLeftPoint,
topRightPoint,
time_stride = 1,
lat_stride = 1,
lon_stride = 1,
verbose = True
)
where,
edata_gridded: A gridded Eratos dataset that contains the key variablevar: The variable key of the variable to fetchstartDate: The start date for the fetched timeseries: "2021-01-01" following the Eratos Date-Time Data StandardsendDate: The end date for the fetched timeseries: "2022-01-01"bottomLeftPoint: The bottom left point for the fetched Geospatial Grid: "POINT(147, -44)" following the Eratos Location Data StandardstopRightPoint: The top right point for the fetched Geospatial Grid: "POINT(150, -42)"time_stride: The stride in the time dimension, default = 1lat_stride: The stride in the latitude dimension, default = 1lon_stride: The stride in the longitude dimension, default = 1- 'verbose : Get print statement that details the specifics of the output (True/False), default = True
Function Standard Use Case
#Eratos adapter and credentials system
from eratos.creds import AccessTokenCreds
from eratos.adapter import Adapter
from getpass import getpass

eratos_id = getpass('Enter the eratos key id:')
eratos_secret = getpass('Enter the eratos secret:')

ecreds = AccessTokenCreds(
  eratos_id,
  eratos_secret
)

eadapter = Adapter(ecreds)

# Request acccess to a dataset resource in Eratos
max_temperature_data = eadapter.Resource(ern='ern:e-pn.io:resource:eratos.blocks.silo.maxtemperature')

# Access the gridded dataset via the Gridded API:
gridded_max_temperature_data = max_temperature_data.data().gapi()

# Query the Gridded API to see what variables are inside the dataset
print(dict.keys(gridded_max_temperature_data.variables()))

startDate = "2021-01-01"
endDate = "2022-01-01"
#9 times out of 10 this will be the variable you are after in this case ('max_temp')
var = gridded_max_temperature_data.get_key_variables()[0]
bottomLeftPoint = 'POINT(142.180431 -38.189593)'
topRightPoint = 'POINT(149.271033 -34.598160)'

extracted_data = gridded_max_temperature_data.get_3d_subset_as_array(var,startDate,endDate,bottomLeftPoint,topRightPoint)
reticulate::use_condaenv("eratoslabs", required=TRUE)
library(reticulate)
library(rjson)
eratosAdapter <- reticulate::import("eratos.adapter")
eratosCreds  <- reticulate::import("eratos.creds")


path_to_eratos_creds = "PATH_TO_CREDS_AS_JSON_FILE"
creds = fromJSON(file = path_to_eratos_creds)

at <- eratosCreds$AccessTokenCreds(creds$key[1], creds$secret[1])
ad <- eratosAdapter$Adapter(at)

# Pull a dataset resource in Eratos via it's unique ern
max_temperature_data = ad$Resource(ern='ern:e-pn.io:resource:eratos.blocks.silo.maxtemperature')

# Access the gridded dataset via the Gridded API:
gridded_max_temperature_data = max_temperature_data$data()$gapi()

# Query the Gridded API to see what variables are inside the dataset
gridded_max_temperature_data$variables()

startDate = "2021-01-01"
endDate = "2022-01-01"
#9 times out of 10 this will be the variable you are after in this case ('max_temp')
var = gridded_max_temperature_data$get_key_variables()[1]
bottomLeftPoint = 'POINT(142.180431 -38.189593)'
topRightPoint = 'POINT(149.271033 -34.598160)'

extracted_data = gridded_max_temperature_data$get_3d_subset_as_array(var,startDate,
                                                endDate,bottomLeftPoint,topRightPoint)
This function contains a detailed output of what is going on under the hood, so you can best understand if this is your intended output.

The 366 in the first dimension of the shape (366, 139, 140) of the 3D Numpy Array Object represents the 366 days of 2021 in chronological order
Updated 6 months ago
