

Data Stream Data Types
Overview of available data types stored in a datastream
Scalar Data Streams
Scalar Data Streams are used to store scalar quantities that are fully described by a numerical value alone having a single variable per observed phenomenon. Examples of scalars are Temperature, Rainfall, Evapotranspiration, Sap Flow, etc. To ensure scalars are interpretable, units are crucial.
where,
results: a list of results sent or subscribed to by Senaps, the below example containst: Time in ISO 8601 Date-Time eg "2015-11-12T00:00:00.000Z"v: A dictionary of scalar values and it's identifying name or code eg "Temperature" : 1.0
{
  "results" : [
    {
      "t" : "2015-11-12T00:00:00.000Z",
      "v" : {
        "Temperature" : 1.0
      }
    }
  ]
}
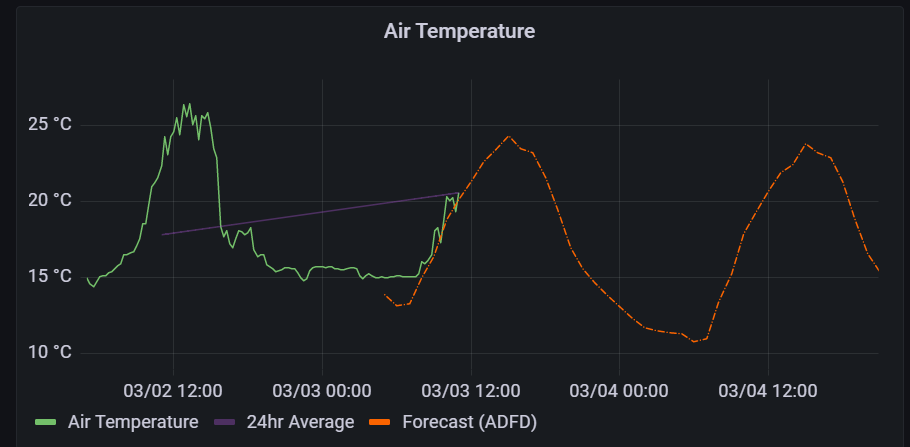
Scalar Data Streams are not limited to IoT sensor data and can be used to store any univariate time series data. A great example of this is pulling the BOM Forecast data (ADFD) for that given sensor, this can be visualized in the Eratos Viewer in tandem with the real recorded values on the ground.
Geolocation Data Streams
Geolocation Data Streams store geo-located trajectory information in the form of x, y, z coordinates and are typically used to store GPS data for example.
where,
results: a list of results sent or subscribed to by Senaps, the below example containst: Time in ISO 8601 Date-Time eg "2015-11-12T00:00:00.000Z"v: A dictionary of points (p) containing the longitude and latitude coordinates of the given sensorcoordinates: Longitude, Latitude, Elevation
{
  "results" : [
    {
      "t": "2015-11-12T00:00:00.000Z",
      "v": {
        "p": {
          "type": "Point",
          "coordinates": [
            150.369105,
            -31.742179,
            415.8
          ]
        }
      }
    }
  ]
Vector Data Streams
Vector Data Streams, like Scalar Data Streams, store scalar values as a list and provide a way to store multiple time-aligned observations in a single multivariate time series.
where,
results: a list of results sent or subscribed to by Senaps, the below example containst: Time in ISO 8601 Date-Time eg "2015-11-12T00:00:00.000Z"v: A dictionary of vectors that contain lists of scalar values and it's identifying name or code eg "Temperature_vec" : [1.0, 2.0, 3.0, NULL, 5.0, 6.0, NULL, 8.0, 9.0, 10.0]
{
  "results" : [
    {
      "t" : "2015-11-12T00:00:00.000Z",
      "v" : {
        "Temperature_vec" : [1.0, 2.0, 3.0, NULL, 5.0, 6.0, NULL, 8.0, 9.0, 10.0]
      }
    }
  ]
}
Document Data Streams
Document Data Streams are a flexible Data Stream type that can contain Json documents or Strings.
where,
results: a list of results sent or subscribed to by Senaps, the below example containst: Time in ISO 8601 Date-Time eg "2015-11-12T00:00:00.000Z"v: A dictionary of json documents (j) or plain text strings (d) eg:
"j" : {"a_key": "a_value"}
"d" : "meaningful string"
{
  "results" : [
    {
      "t" : "2015-11-12T00:00:00.000Z",
      "v" : {
        "j" : {"Person_Count": 4,
              "Female_Count":3,
              "Male_Count":1},
        "d" : "This is the start of something amazing"
      }
    }
  ]
}
Image Data Streams
Image Data Streams are a Data Stream type that supports the following mime types:
"image/tiff", "image/jpeg" and "image/png". Furthermore, The image file must be Base64 encoded in the imageData property during upload, and retrieved as binary with mime type set for displaying on the web or saving to file for example.
where,
results: a list of results sent or subscribed to by Senaps, the below example containst: Time in ISO 8601 Date-Time eg "2015-11-12T00:00:00.000Z"v: A dictionary of mime types (m) and imageData Property (d)m: The image mime type: "image/tiff", "image/jpeg" and "image/png".dThe imageData property that must be Base64 encoded
{
  "results": [{
    "t": "2018-01-03T00:00:00.000Z",
      "v": {
        "m": "image/jpeg",
        "d": "[insert base64 encoded image binary data here]"
      }
    }
  ]
}
Interpolation Type
The interpolation type for a Datastream is a standard metadata object that describes the statistical nature of the data within the stream. Operations can behave differently depending on the interpolation type.
| Interpolation Type | Description |
|---|---|
| Continuous/Instantaneous | A continuous time series indicates the observation result is the value of a property at the indicated instant in time. The points are essentially connected and interpolation may occur between points in order to estimate the value of the property between points. |
| Discontinuous | The sampling of the property occurs such that it is not possible to regard the series as continuous. The time between samples is too large to classify the measurements as continuous. |
| Instantaneous total | Value represents a total attributed to a specific time instant. This is normally generated from an event based measuring device such as a tipping bucket rain gauge. Example: An individual tip of a tipping bucket rain gauge. |
| Average in preceding interval | Value represents the average value over the preceding interval. Example: Daily mean discharge |
| Maximum in preceding interval | Value represents the maximum value that was measured during the preceding time interval. Example: Monthly maximum discharge |
| Minimum in preceding interval | Value represents the minimum value that was measured during the preceding time interval. Example: Daily minimum temperature. |
| Preceding total | Value represents the total of measurements taken within the previous time interval. Example: Daily pan evaporation |
| Average in succeeding interval | Value represents the average value over the following interval. Example: Daily mean discharge encoded as value representing beginning of interval (ODM style) |
| Succeeding total | Value represents the total of measurements taken within the following time interval. |
| Minimum in succeeding interval | Value represents the minimum value for the following interval. |
| Maximum in succeeding interval | Value represents the maximum value for the following interval. |
| Constant in preceding interval | Value is constant in the preceding interval. Example: Alarm level |
| Constant in succeeding interval | Value is constant in the succeeding interval. Example: Alarm level |
| Statistical | Interpolation type is defined by a statistical method. |
Updated 12 months ago